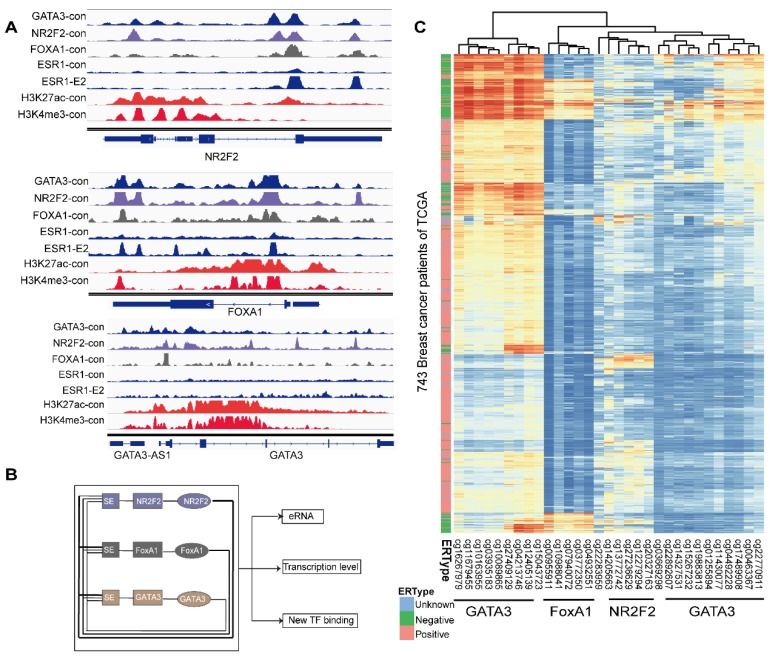
Figure 6.
The relative hypermethylation of promoter regions at the three genes in ER negative patients contributes to the low expression. (A) The IGV shows the ChIP-seq signals of H3K4me3 and H3K27ac and the corresponding transcription factors at the NR2F2, FOXA1, GATA3 and ERα gene loci in the MCF-7 cell line. (B) Schematic diagram showing that genes encoding these three factors are themselves driven by super-enhancers and form an interconnected feedback loop. (C) Unsupervised clustering of 743 breast cancer patients from TCGA with the methylation probes assigned to the three genes (NR2F2, FOXA1 and GATA3), showing that methylation of the promoter regions of the genes is inversely related to the ERα histological status. Each row represents a patient, and each column represents a probe. The relative level of DNA methylation (normalized and transformed beta value) is represented with the colour bar.

