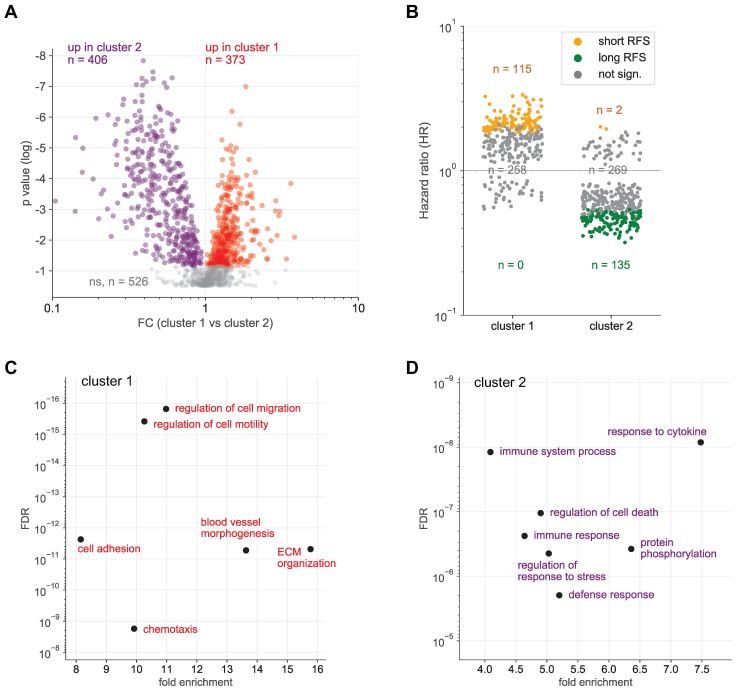
Figure 2.
Identification of SOMAscan protein signals differentially regulated in ascites clusters 1 and 2. (A) Volcano plot showing the protein signals significantly upregulated in cluster 1 in red and in cluster 2 in blue. (B) Opposite linkage of cluster 1 and 2 protein signals in ascites to relapse-free survival (RFS). The plot shows the hazard ratios (HR) for cluster 1 (red) and cluster 2 proteins (blue). Long RFS: logrank p <0.05 (for RFS) and HR<1. Short RFS: logrank p <0.05 and HR>1; not sign.: logrank p ≥0.05. (C) Functional annotation of proteins underlying the upregulated signal in cluster 1 by gene ontology (GO) enrichment analysis. p values are plotted against fold enrichment. Only specific non-redundant terms with p values <10-8 and fold enrichment ≥8 are shown. (D) Functional annotation of proteins underlying the upregulated signal in cluster 2 analogous to panel C.

