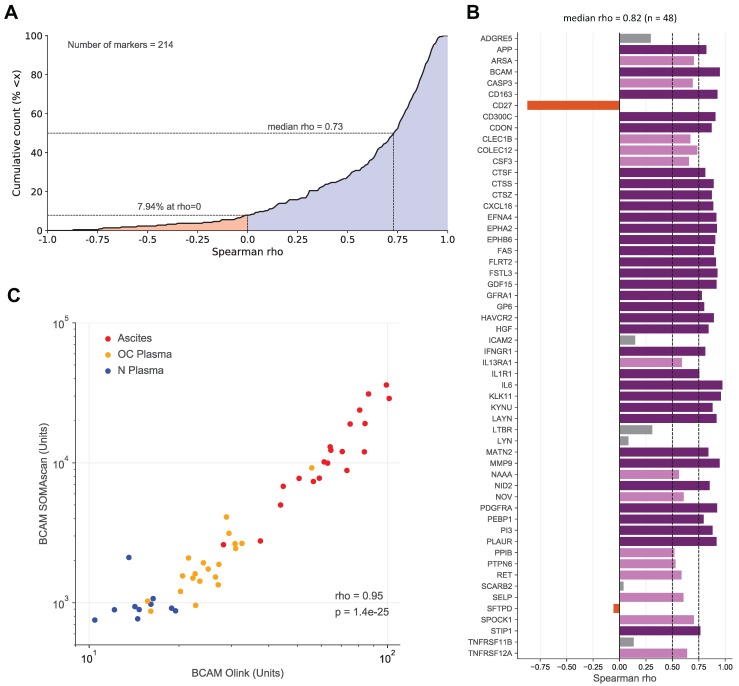
Figure 5.
Correlation of SOMAscan and PEA data for markers in ascites and plasma. (A) Data for 214 markers in 10 N-plasma, 20 OC-plasma and 20 ascites samples were analyzed to calculate the cumulative distribution of Spearman correlation coefficients (ρ) between SOMAscan and PEA signal intensities, resulting in a median value of ρ = 0.73. The light blue area indicates positive correlations (92.52% of all instances), light red indicates negative correlations (7.48%). (B) Spearman correlations for all markers associated with RFS (SOMAscan) and present in the Olink panel measured (n=48) in the same datasets as in (A). Dark purple: ρ>0.75; light purple: 0.75≥ρ>0.5; gray: 0.5≥ρ>0; red-brown: ρ<0. (C) Dot plot of SOMAscan and PEA data (n=50).

