Figure 7.
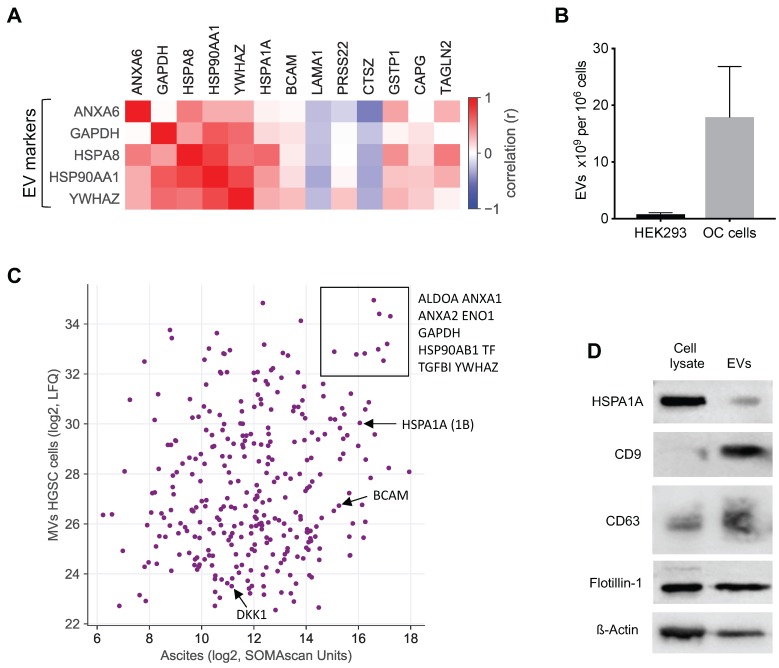
EVs as the putative origin of RFS-associated proteins. (A) Heatmap depicting the correlation (Spearman ρ on SOMAscan ascites samples) of EV markers with highRFS-associated SOMAscan protein signals (median concentrations >10.000 SOMAscan units). (B) EV numbers in the supernatant of HEK293 cells (n=4) and HGSC cells (n=6) determined by Nanoparticle Tracking Analysis. (C) Proteins present in EVs from HGSC tumor cells and in HGSC ascites. Median LFQ values determined by MS are plotted against median SOMAscan units. Rectangle: proteins with the highest concentration in both EVs and ascites. Arrows indicate the data points for BCAM, DKK1 and HSPA1A. (D) Detection of HSPA1A in EVs by Western blotting. CD9, CD63 and flotillin were included as known constituents of EVs and ß-actin as a loading control.

