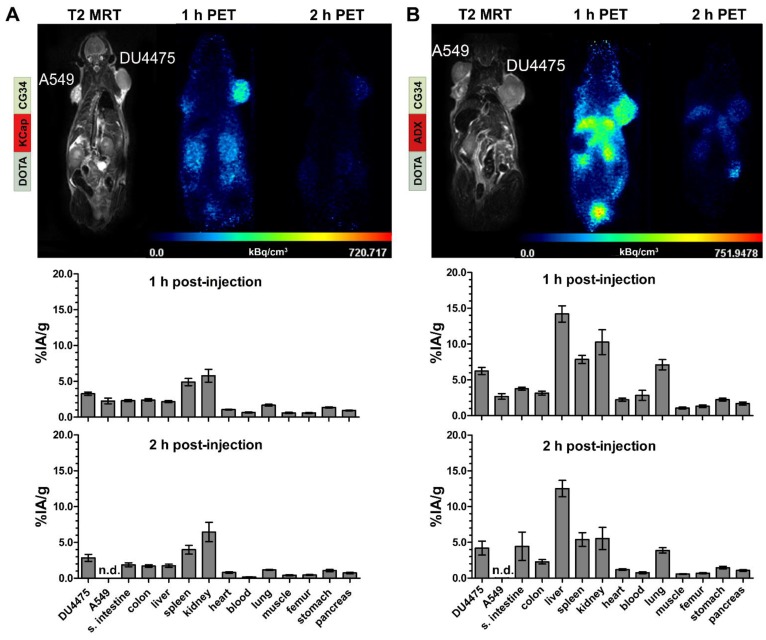
Figure 4.
PET/MR imaging and biodistribution study with CMKLR1-targeted, chemerin-based tracers [68Ga]Ga-DOTA-KCap-CG34 and [68Ga]Ga-DOTA-ADX-CG34. Representative static PET images were acquired for 30 minutes one and two hours post-injection (p.i.) of 20 MBq 68Ga-labeled conjugate in DU4475 (target-positive) and A549 (negative) tumor model (upper panel). For quantitative analysis of tracer biodistribution, 10 MBq of the tracer was injected intravenously and tissue was analyzed ex vivo one or two hours p.i. Values for tracer uptake are indicated as percent injected activity per gram tissue (% IA/g) (lower panel). (A) The T2-weighted MRI image clearly shows both tumors on the animal´s shoulders. The PET images reveal [68Ga]Ga-DOTA-KCap-CG34 uptake in DU4475 after one hour, which decreased two hours p.i. The A549 tumor accumulated much less activity. Beside tumor uptake, the tracer accumulated in the kidneys after one hour. The quantitative analysis of biodistribution one hour p.i indicates more tracer uptake in DU4475 than in A549. Predominant renal excretion is represented by a noticeable kidney value (3 ≤ n ≤ 15; mean ± SEM). (B) Injection of [68Ga]Ga-DOTA-ADX-CG34 resulted in strong DU4475 and low A549 uptake. In addition, tracer uptake was detected in kidneys and liver. Quantitative analysis of tracer biodistribution after one hour shows a high uptake in DU4475, and less in A549 tumors. Furthermore, the more hydrophobic tracer accumulated in the kidneys, liver and spleen and led to an overall stronger and longer organ accumulation (5 ≤ n ≤ 16; mean ± SEM). (n.d. = not determined)

