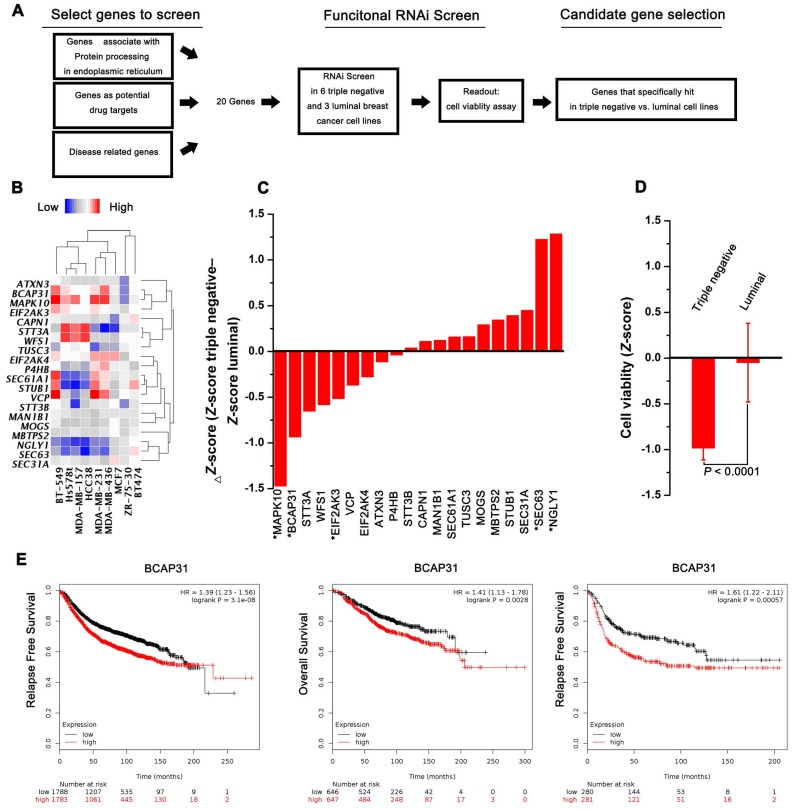
Figure 1.
RNAi screening and KMplot strategy to identify regulators of basal-like breast cancer. (A) Schematic highlighting the criteria for gene selection and the experimental setup of the RNAi screen. (B) Heat map representing the expression of selected transcripts in different cells as determined by qPCR analysis. (C) Column showing the average Z-score of triple-negative cell lines minus the average Z-score of luminal cell lines (ΔZ-score) for all the genes included in the RNAi screen. A negative value indicates that the siRNA decreased cell proliferation more in the triple-negative cell lines. * P < 0.05 comparing triple-negative and luminal Z-scores. (D) The average triple-negative and luminal Z-scores for all cell lines for BCAP31. The P value indicates a statistically significant difference between triple-negative and luminal lines. Error bars represent the SD. (E) Kaplan-Meier survival curves showed poorer RFS and OS with high BCAP31 expression than those with low BCAP31 expression in breast cancer, left two panels, and in basal-like breast cancer, right panel.

