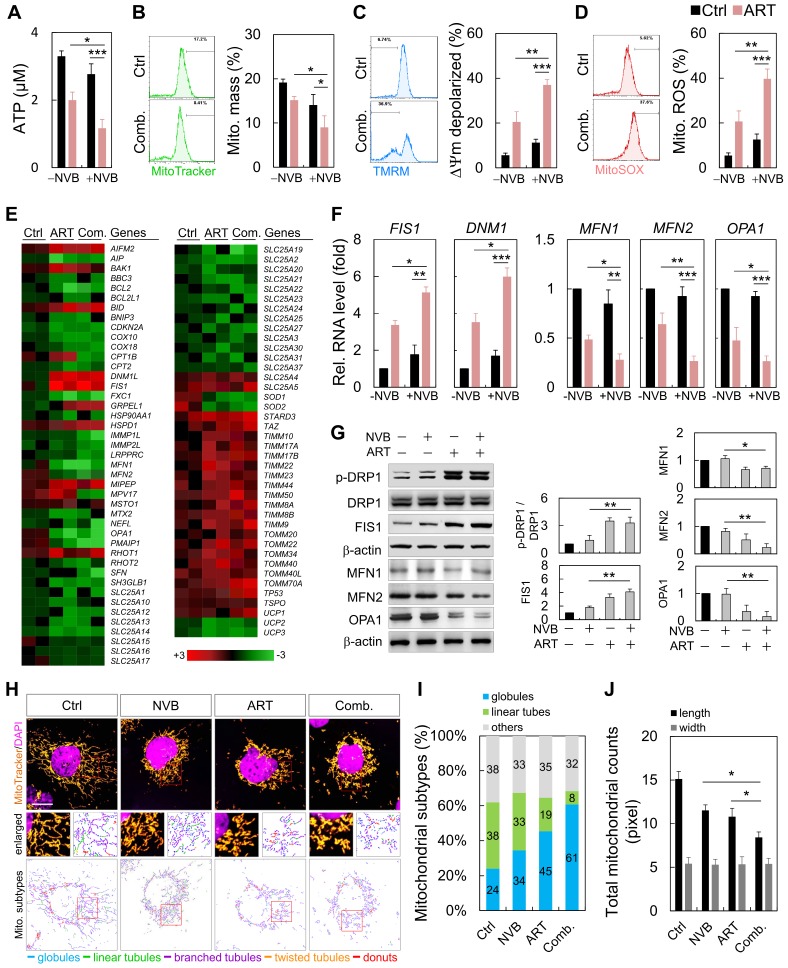
Figure 2.
ART/NVB treatment regulated mitochondrial functions and dynamics in MDA-MB-231 cells. (A) ATP levels, (B) mitochondrial mass, (C) mitochondrial membrane potential, and (D) mitochondrial ROS levels in MDA-MB-231 cells treated with ART or/and NVB. (E) Heatmap demonstrating the relative expression levels of mitochondrial genes, based on PCR array analysis. (F, G) mRNA- and protein-expression levels were verified by qRT-PCR and immunoblotting. Protein expression levels were normalized to β-actin. (H) Mitochondria in MDA-MB-231 cells, with or without ART/VNB treatment, were labeled with MitoTracker and subjected to confocal microscopy. The mitochondria were classified using MicroP software according to their morphology: globules, linear tubules, branched tubules, twisted tubules, and donuts. (I) Three major types of mitochondria were quantified: globules, linear tubes, and others. (J) The total length and width of each mitochondrion was determined. *P < 0.05, **P < 0.01, and ***P < 0.001. Scare bar = 20 μm

