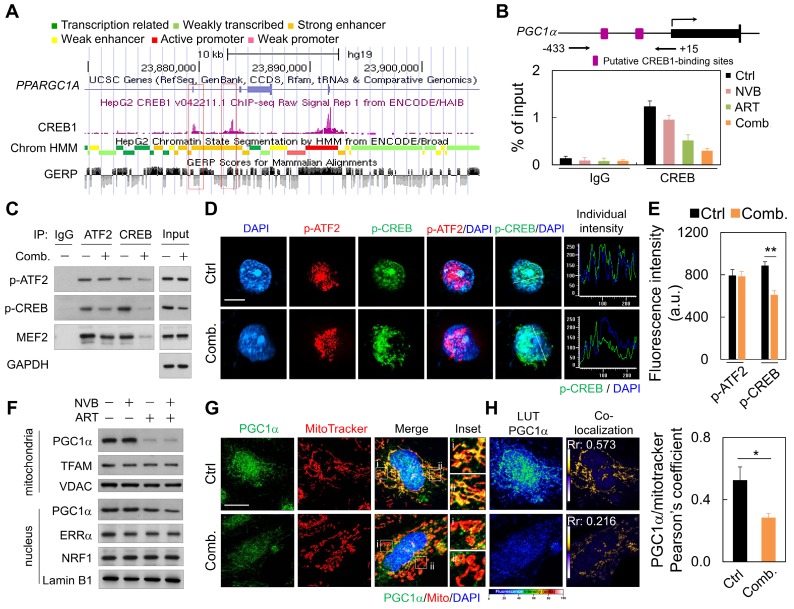
Figure 3.
ART/NVB decreased PGC1α expression by inhibiting the ATF2/CREB pathway. (A) Scheme (UCSC Genome Browser hg19) of the human genomic region encompassing the PGC1α promoter. The purple peaks represent the CREB-binding regions, according to ENCODE. The red square shows the amplified region in the PGC1α promoter. (B) ChIP assay performed with MDA-MB-231 cells treated with ART or/and NVB. The PGC1α promotor region was immunoprecipitated with an anti-CREB antibody and amplified by qRT-PCR. (C) Immunoblot analysis of proteins immunoprecipitated from ART/NVB-treated cells using antibodies against IgG, ATF2, or CREB. (D) Representative immunofluorescence patterns of p-ATF2 (Thr69-71) and p-CREB (Ser133). (E) Quantification of Pearson's co-localization coefficients between Pa-TF2 (Thr69-71) and p-CREB (Ser133). (F) Relative mitochondrial and nuclear levels of proteins related to mitochondrial biogenesis, detected in lysates from ART/NVB-treated breast cancer cells by Western blotting. (G) Confocal images and mitochondrial co-localization analysis of PGC1α. The insets highlight two representative co-localization images (30× magnification of the regions in the white squares). (H) Calculation and quantification of Pearson's co-localization coefficients between PGC1α and MitoTracker in ART/NVB-treated cells. *P < 0.05 and **P < 0.01. Scare bar = 10 μm

