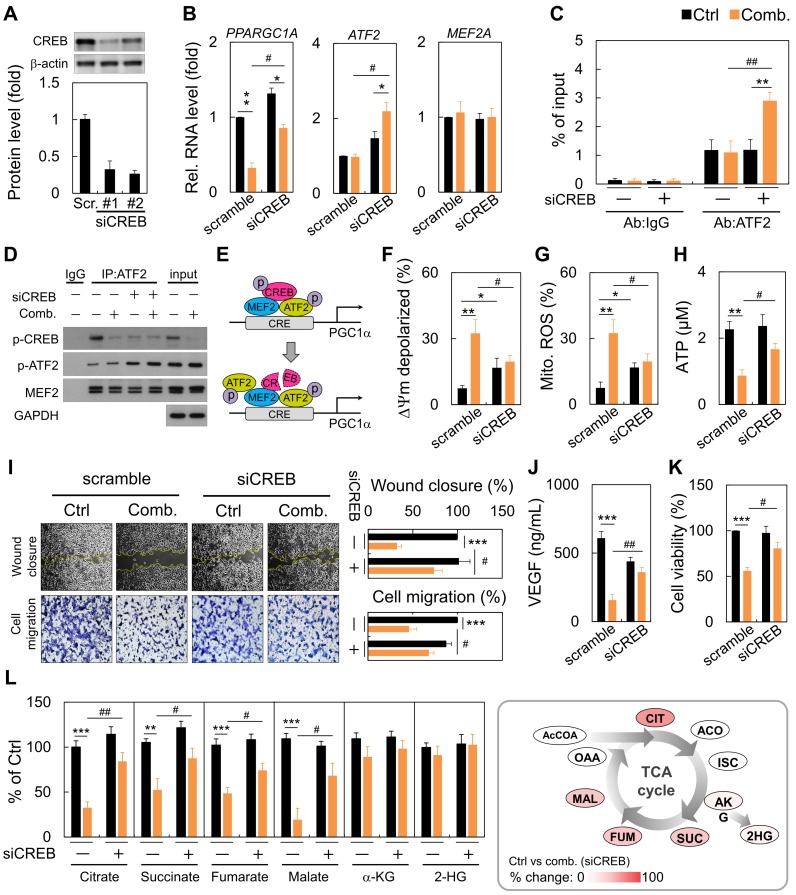
Figure 4.
Reversal of the synergistic effects of combination ART/NVB treatment by down-regulating CREB expression in MDA-MB-231 cells. (A) Immunoblotting and quantification of CREB protein levels in MDA-MB-231 cells after treatment with siCREB. The lower panel shows densitometric quantification of bands relative to those in the scrambled siRNA group. (B) PPARGC1A, ATF2, and MEF2A mRNA levels in cells treated with ART/NVB or vehicle control and either siCREB or a scrambled siRNA control. (C) ChIP assay results with MDA-MB-231 cells following transfection with siRNAs (siCREB or scrambled siRNA) and treatment with ART/NVB or vehicle control. Potential ATF2-binding sites in the PGC1α locus were amplified by qRT-PCR. (D) SDS-PAGE and immunoblot analysis of proteins immunoprecipitated with anti-ATF2 and IgG antibodies in MDA-MB-231 cells transfected with siRNAs (siCREB or scrambled siRNA) and treatment with ART/NVB (or vehicle control). (E) Proposed model whereby ART/NVB regulates interactions between CREB, ATF2, and MEF2. (F-H) Mitochondrial membrane potential, and mitochondrial ROS and ATP production in CREB-knockdown cells treated with ART/NVB. (I) Motility and migration were examined in CREB-knockdown cells after ART/NVB treatment. (J) VEGF levels in CREB-knockdown cells after ART/NVB treatment. (K) MDA-MB-231 cells were treated with ART/NVB for 24 h after transfection with siCREB, and cell viability was determined by performing CCK8 assays. (L) Measurement of TCA cycle intermediates in cancer cells silenced for CREB and exposed to ART/NVB for 24 h. Quantification analysis of TCA cycle metabolites was relative to their respective control. * P < 0.05, ** P < 0.01, *** P < 0.001, as compared with each control. #P < 0.05 and #P < 0.01, as compared with scrambled-siRNA group

