Figure 6.
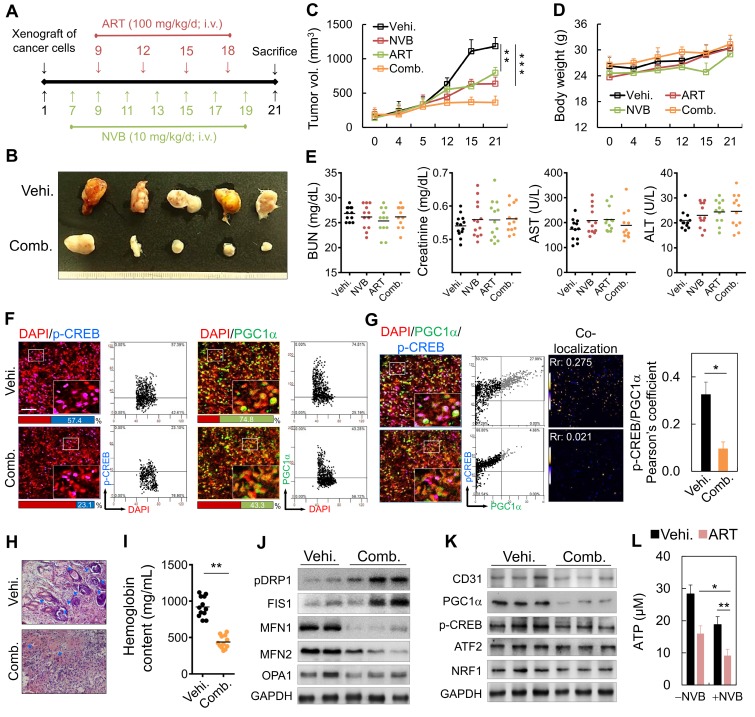
Metronomic low-dose ART chemotherapy combined with NVB exhibited anti-angiogenic and anti-tumor activities in vivo. (A) Flow chart for the in vivo experimental design and treatment schedule. (B) Volumes of tumors in mice treated with ART combined with NVB. Mice were treated by i.v. injection with vehicle or ART/NVB. (C, D) Quantification of tumor volumes and body weights in mice treated with NVB and ART/NVB. (E) Blood biochemical analysis indicated that no significant changes occurred in the serum ALT, AST, BUN, or Cr levels. ALT, alanine aminotransferase; AST, aspartate aminotransferase; BUN, blood urea nitrogen. (F) Tumor sections were observed by immunostaining for CREB and PGC1α. Quantitative analysis of CREB- and PGC1α-positive cells in tumors treated with ART and NVB. The positive cells showed fluorescence in tumors treated with NVB and ART/NVB. Confocal microscopy images of co-staining and scatter plots for pC-REB, PGC1α, and DAPI are shown. Representative dot plots showing CREB and PGC1α expression in mouse biopsies, obtained using a flow cytometry-like analysis system (TissueQuest). (G) Confocal and co-localization analyses of p-CREB and PGC1α. CREB and PGC1α colocalization is presented as the product of the differences from the mean. Yellow or blue color pixels indicate colocalization or segregation, respectively. (H) Inhibition of blood vessel formation by ART/NVB treatment. A solid tumor was fixed, sectioned, and stained with H&E. Blue arrows indicate positive blood vessels. (I) Relative angiogenesis was analyzed based on the red blood cell hemoglobin level, as determined using the Drabkin method. (J, K) The protein-expression levels of CD31, pPGC1α, p-CREB, ATF2, NRF1, pDRP1, FIS1, MFN1, MFN2, and OPA1 were detected by western blotting of tumor tissue extracts. (L) ATP levels in tumor tissue extracts. *P < 0.05, **P < 0.01, and ***P < 0.001. Scare bar = 50 μm

