Figure 2.
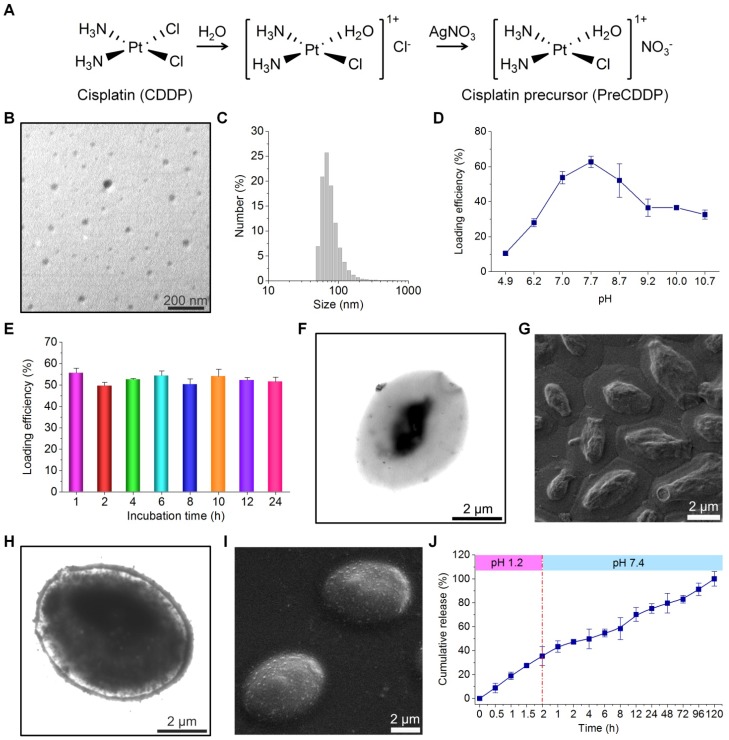
Fabrication and characterization of PreCDDP-loaded YCs. (A) The synthetic route of a CDDP precursor (PreCDDP). (B-C) TEM image (B) and size distribution profile (C) of PreCDDP-derived nanoprecursors in aqueous solution. (D-E) The effect of buffer pH values (D) and incubation time (E) on loading efficiency of PreCDDP in YC. (F-G) TEM (F) and SEM (G) images of YC prepared under optimized core-removing conditions. (H-I) TEM (H) and SEM (I) images of PreCDDP-loaded YC. (J) In vitro release profile of PreCDDP/YC in aqueous solutions simulating gastrointestinal conditions. Data in (D, E, J) are mean ± SD (n = 3).

