Figure 6.
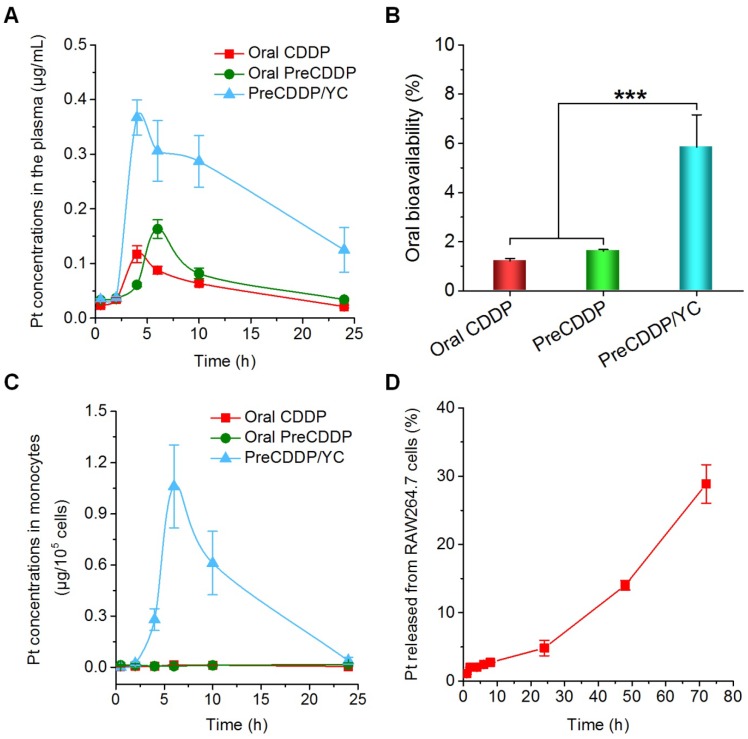
Pharmacokinetic studies after oral administration of different Pt-containing formulations in rats at 6.0 mg/kg. (A) The plasma Pt concentration-time curves after oral delivery of CDDP, PreCDDP, or PreCDDP/YC. (B) Oral bioavailability values of CDDP, PreCDDP, and PreCDDP/YC that were calculated as the AUC ratio of each oral formulation to i.v. CDDP. (C) The Pt concentrations in peripheral blood monocytes after oral administration of CDDP, PreCDDP, or PreCDDP/YC. (D) The Pt release profile in RAW264.7 cells after incubation with PreCDDP/YC at 10 μg/mL of PreCDDP for 2 h. Data are mean ± SD (n = 5); ***p < 0.001.

