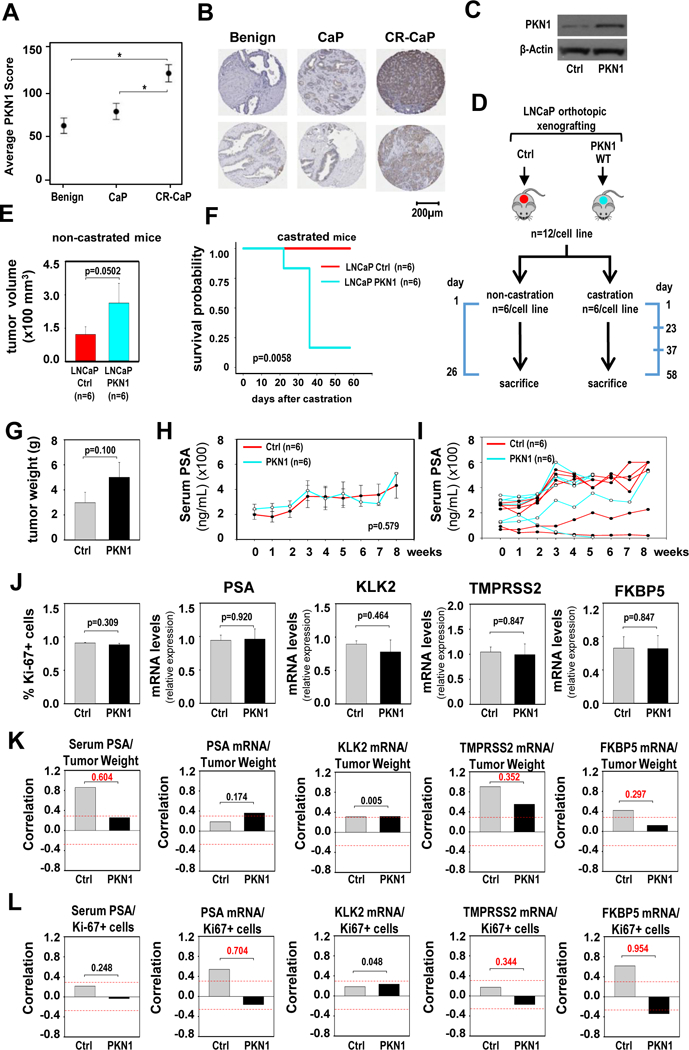
Figure 2. PKN1 overexpression provides CaP growth advantage.

A. Average PKN1 immunostaining intensity score obtained from 36 benign, 36 CaP and 36 CR-CaP patient samples. Data are expressed as average intensity score +/− standard error. Statistical analysis was done using Tukey-Kramer tests. B. Two representative images of PKN1 immunostaining for each group of patient tissues. Matching benign prostate and localized CaP tissues from the same radical prostatectomy specimens are shown. Magnification: 40x. C. Western blot showing PKN1 expression levels in LNCaP cells that stably express pcDNA3.1 (Ctrl), or pcDNA3.1 vectors that encode (WT) wild-type PKN1. The blot was reprobed for ß-actin as a loading control. D. Schematic representation of the design and timeline for the xenograft experiment. Timeline marks key dates, and the scale is not proportional. Cells stably expressing pcDNA3.1 (Ctrl), or pcDNA3.1-PKN1-WT were orthotopically grafted in the anterior prostate of nude mice (n=12/cell line). After 2 months, mice were assigned into non-castration and castration groups (n=6/cell line). E. For each cell line, mice from the non-castration group were sacrificed 26 days later, and tumor volumes were measured. For the control group, values of 5 animals were recorded and shown. Columns, means of values obtained from each group; red, LNCaP-pcDNA3.1 (Ctrl); cyan, LNCaP-pcDNA3.1-PKN1-WT; bars, SEM values. Unit, mm3. Statistical analysis used Wilcoxon tests. F. Mice from the castration groups were scheduled to be sacrificed 2 months after castration. For some of these mice, this time point had to be moved up because their tumor burden exceeded that allowed by IACUC guidelines. A survival plot is shown for the animals from the castration group for each cell line. Red, LNCaP-pcDNA3.1 (Ctrl); cyan, LNCaP-pcDNA3.1-PKN1-WT. Statistical analyses were done using Mantel-Cox test (logrank test).
G. Tumor weights at time of harvest of castrated animals. Columns, means; bars, SEM values. Statistics used Wilcoxon tests. H. Kinetics of serum PSA levels in castrated animals, expressed in ng/ml. Weekly measurements are shown starting at time of castration (week 0). Columns, means; bars, SEM values. Statistics used ANOVA tests. I. Data from panel H, graphed for individual animals. J. Percentage of Ki67-positive cells (left panel), and mRNA expression levels for AR target genes PSA, KLK2, TMPRSS2 and FKBP5 (4 right panels) in PKN1-overexpressing tumors (PKN1) and control (Ctrl) tumors. mRNA expression for AR target genes was normalized to GAPDH expression and are represented as relative expression using one of the values from the control group as 1. Columns, means of values obtained from 6 independent xenografts; bars, SEM values. Statistical analyses was done using T-tests. K and L. Correlation between tumor weight (K) or percentage of Ki-67- positive tumor cells (L) and serum PSA levels and mRNA expression levels of PSA, KLK2, TMPRSS2 and FKBP5 at tumors harvested at sacrifice. Red dashes lines indicate Pearson correlation coefficient of 0.3. Numerical values indicate difference in correlation coefficient between PKN1-overexpressing and control group, in absolute values.
