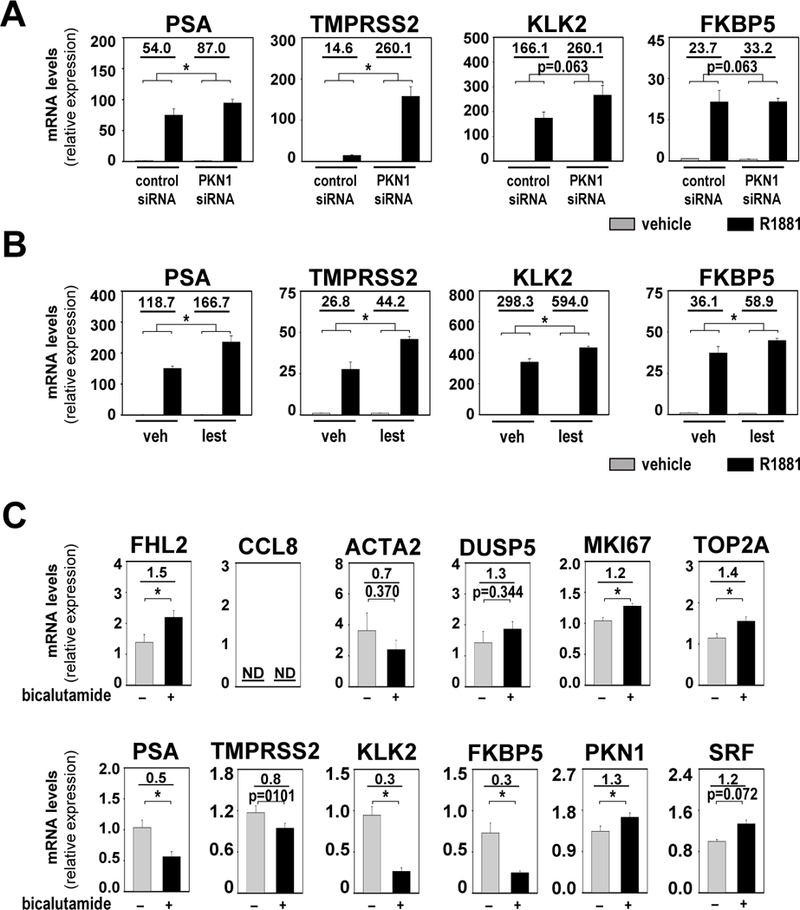
Figure 5. Differential regulation of SRF and AR target genes.

A and B. LNCaP cells were transfected with siRNA targeting PKN1 or non-specific control siRNA. At 42 hours after transfection, cells were treated with vehicle (ethanol) or 5nM of the synthetic androgen R1881 (A). LNCaP cells were treated with either vehicle (veh, DMSO) or 50nM lestaurtinib (lest) in combination with vehicle (ethanol) or 5nM R1881 (B). Cells were harvested 48 hours after treatment and androgen-induction of direct AR target genes PSA, KLK2, TMPRSS2 and FKBP5 was evaluated via real-time RT-PCR. Target gene mRNA levels were normalized to GAPDH expression and are represented as relative expression using one of the values obtained from vehicle-treated control siRNA-transfected conditions as 1. Columns, means of values obtained from independent biological triplicates; grey, vehicle treatment; black, R1881 treatment; bars, SEM values.*, p<0.05, all statistical analyses used Wilcoxon tests. Numeric values in plots indicate the average fold change in androgen regulation. Low, low exposure, high, high exposure. C. Analysis of RNA obtained from PCSD1 xenografts from mice that were treated with vehicle (0.9% benzyl alcohol, 1% Tween-80, 0.5% Methylcellulose) or 50mg/kg/day bicalutamide for 18 days. Effect of bicalutamide treatment on SRF target genes FHL2, CCL8, DUSP5 and ACTA2, AR target genes PSA, KLK2, TMPRSS2 and FKBP5, proliferation-associated genes MKI67 and TOP2A, and SRF and PKN1 was evaluated by real-time RT-PCR. Target gene mRNA levels were normalized to GAPDH expression and are represented as relative expression values using one of the value obtained from vehicle-treated control mice as 1. Columns, means of values obtained from 5 independent biological replicates; grey, vehicle treatment; black, bicalutamide treatment; bars, SEM values. *, p<0.05, all statistical analyses used T-tests tests. Numeric values in plots indicate the average fold change in mRNA expression. ND, not determined.
