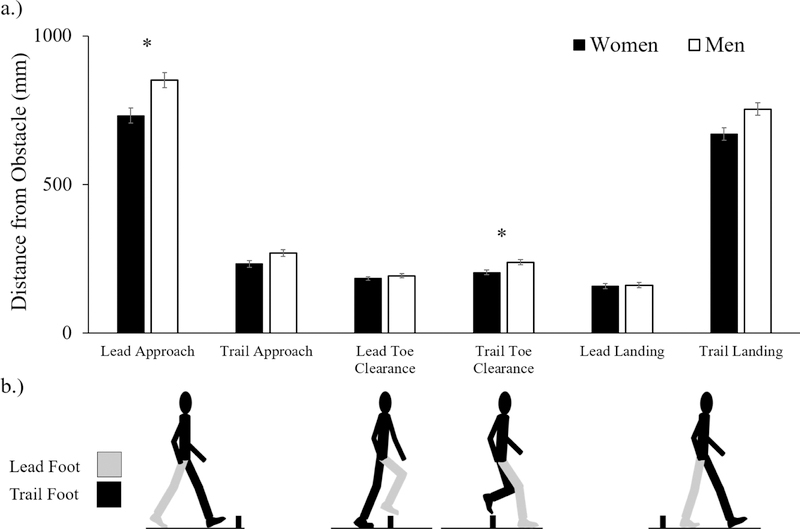
Figure 2.
Women step closer to obstacles than men. 2a) Obstacle crossing foot placement results for men and women showing women approached the obstacle more closely. Presented as non-normalized mean values for distance from obstacle (mm) and standard error. See supplemental data for corrections by leg length. 2b) Icons represent step outcomes: approach distance for lead and trail foot, crossing toe-clearance for lead and trail foot, and landing distance for lead and trail foot; lead foot=grey, trail foot=black. Asterisk indicates significant group differences p < 0.05.

