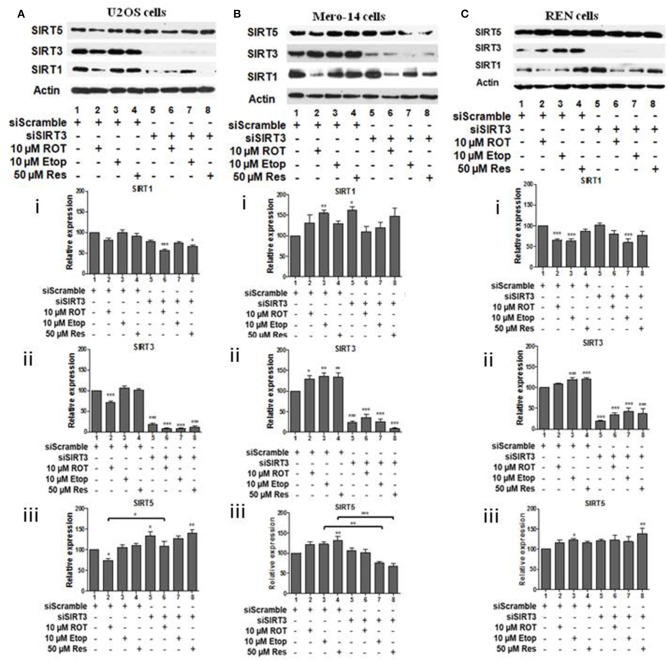
Figure 3.
Effect of silencing of SIRT3 on SIRT1 and on SIRT5 protein levels. Protein levels of SIRT1, SIRT3, and SIRT5 were determined by SDS PAGE followed by Western blot. Silencing of SIRT3 gene expression in (A) U2OS, (B) Mero-14, and (C) REN cells. Protein levels were analyzed using antibodies specific for the SIRT1, SIRT3, or SIRT5. Actin was used as a loading control. Representative western blot is shown. Image J was used for quantification. Values are normalized to actin and then to control. Error bars represent standard error of the mean of three independent experiments. One-way analysis of variance (ANOVA) and Tukey's multiple comparisons post-test were used for the analysis of data. p < 0.05 was considered to be statistically significant. p < 0.001 is indicated with (***), p < 0.01 with (**), and p < 0.05 with (*).

