Figure 7.
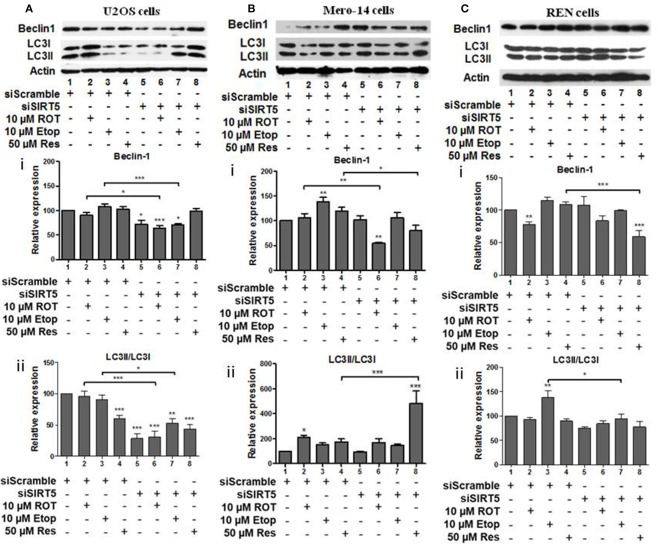
The effect of SIRT5 silencing on LC3 and Beclin-1 protein levels. (A) U2OS, (B) Mero-14, or (C) REN cells were transfected with either scrambled siRNA or SIRT-5 siRNA and treated with rotenone, etoposide, or resveratrol or left untreated as indicated. Protein levels were analyzed using antibodies specific for the LC3 and Beclin-1 autophagy markers. Actin was used as a loading control and LC3II/LC3I ratio was calculated. Representative western blot is shown. Image J was used for quantification. Values are normalized to actin and then to control. Error bars represent standard error of the mean of three independent experiments. One-way analysis of variance (ANOVA) and Tukey's multiple comparisons post-test were used for the analysis of data. p < 0.05 was considered to be statistically significant. p < 0.001 is indicated with (***), p < 0.01 with (**), and p < 0.05 with (*).

