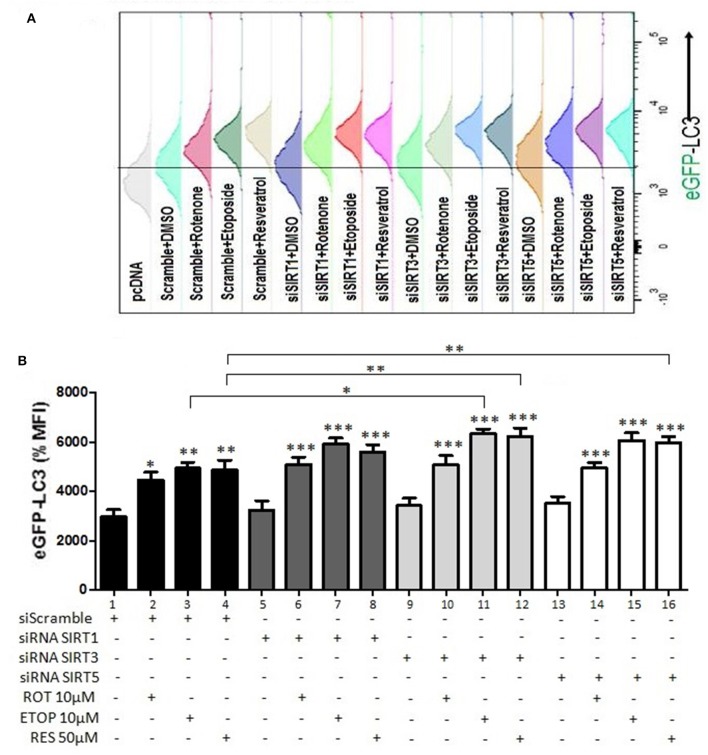
Figure 8.
Regulation of autophagy by SIRT family members (GFP-LC3 punctate staining). (A) Histogram indicating the GFP-LC3 levels detected and quantified in U2OS cells transiently transfected with GFP-LC3 and a plasmid expressing the CD20 surface marker together with either scramble or siRNA targeting SIRT1, SIRT3, or SIRT5 and treated with rotenone, etoposide, or resveratrol as indicated. (B) Diagram indicating the analysis of the relative GFP-LC3 levels detected in U2OS cells transiently transfected with GFP-LC3 and a plasmid expressing the CD20 surface marker together with either scramble (1–4) or siRNA targeting SIRT1 (5–8), SIRT3 (9–12), or SIRT5 (13–16). The values obtained using flow cytometry in different conditions were normalized to those obtained from cells transfected with scramble and treated with DMSO which were arbitrarily set to 100. p < 0.001 is indicated with (***), p < 0.01 with (**), and p < 0.05 with (*).

