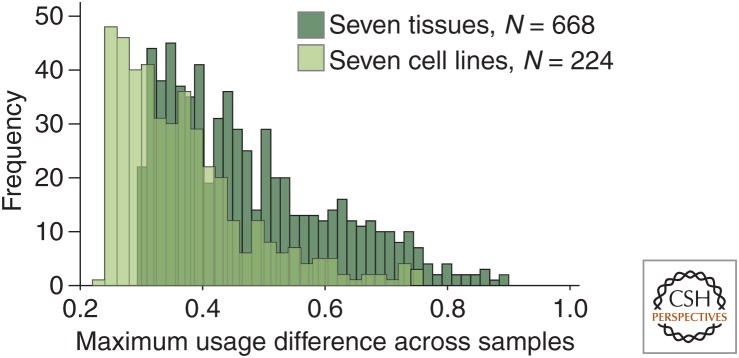
Figure 2.
Primary cells show a higher number and a greater magnitude of cell type–specific changes in 3′ untranslated region (3′ UTR) isoform expression. 3′-seq data are from Lianoglou et al. (2013) and were used to calculate the maximum difference in usage of alternative polyadenylation sites across seven tissues and seven cell lines. Usage is the fraction of reads mapping to a single polyadenylation site out of all the reads mapping to the 3′ UTR. Shown are the 50% of genes with most variable 3′ UTR isoform expression. Only genes that generated two 3′ UTR isoforms were included in the analysis.

