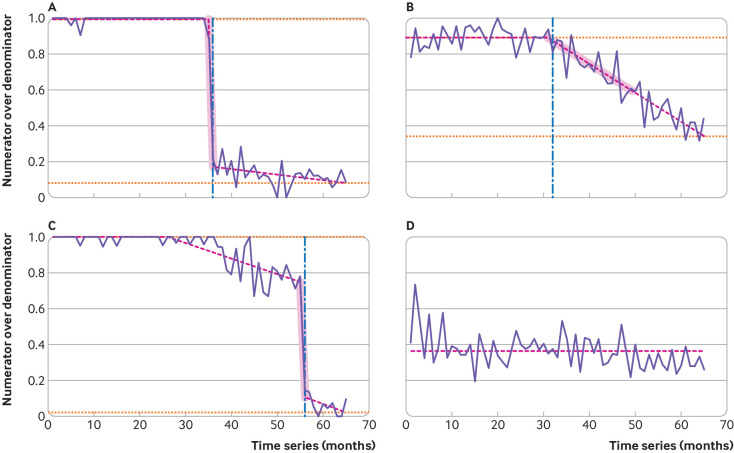
Fig 1.
Examples of practice time series and measured attributes for desogestrel change (from branded to generic). Proportion of Cerazette relative to total desogestrel prescribed of four representative general practices is shown in solid purple lines. Fitted model and detected breaks using trend indicator saturation are shown in pink dashed lines. Commencement of the largest negative shift is marked with a vertical dashed blue line; additional breaks are indicated by changes in the slope of the pink dashed line. The measured slope is highlighted in pink shaded areas, and the pre-break level and final level at the end of the sample are indicated by horizontal orange dotted lines

