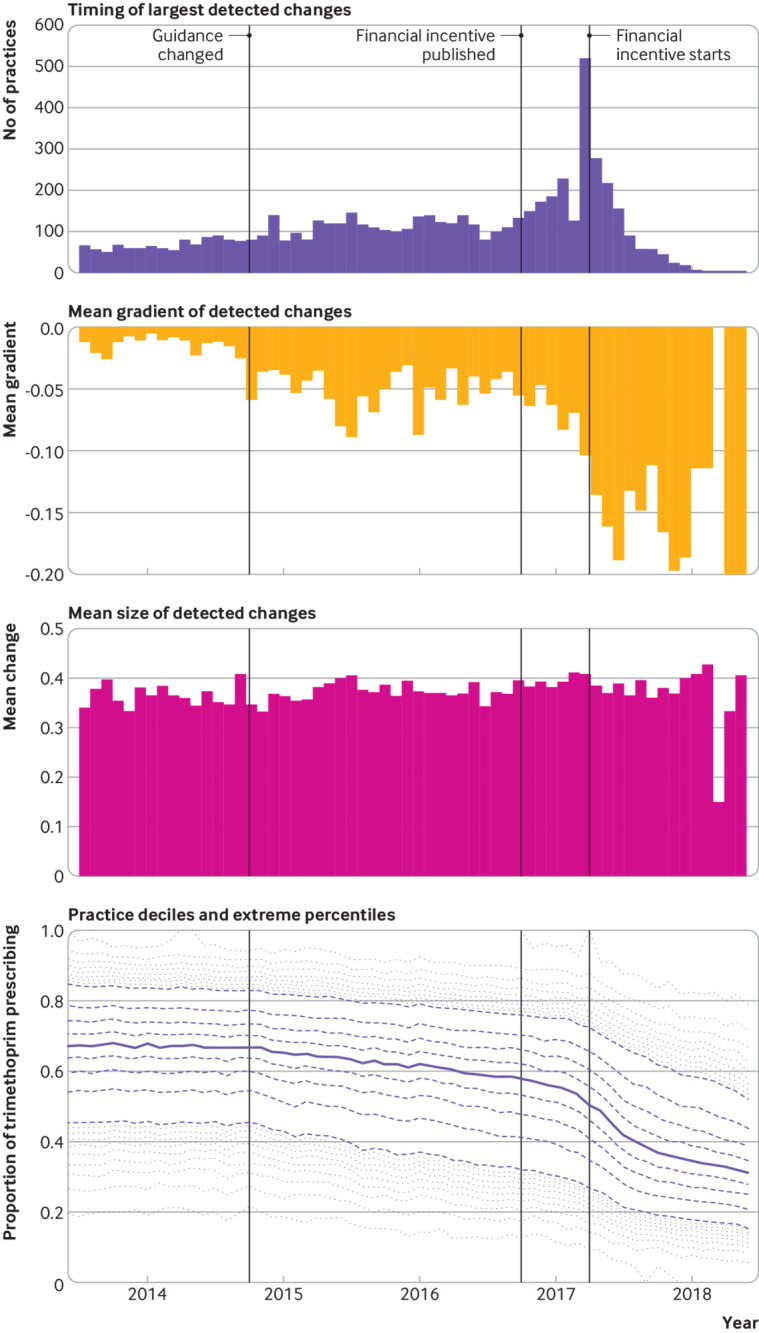
Fig 3.

Response of general practices to a change in antibiotic prescribing guidance (from trimethoprim to nitrofurantoin for uncomplicated urinary tract infection). Top panel=number of practices with their largest detected downward change in each month. Second panel=mean slope of the detected change for all practices changing in that month. Third panel=mean magnitude of detected change for all practices changing in that month. Bottom panel=median trimethoprim prescribing as a proportion of all total trimethoprim and nitrofurantoin prescribing (solid line), along with deciles (dashed lines) and extreme percentiles (dotted lines)
