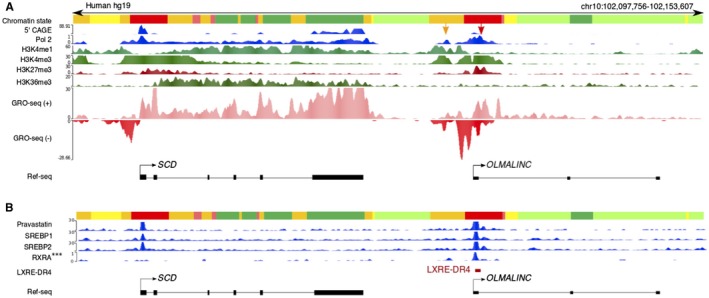
Figure 2.

OLMALINC resides downstream of SCD and demonstrates similar regulatory regions. (A) The annotated OLMALINC promoter (red) and enhancer (orange) demonstrate histone methylation marks, 5′ CAGE, and polymerase II ChIP‐seq binding sites using ENCODE data. There are two TSSs: the orange arrow denotes the enhancer‐TSS, while the red arrow highlights the promoter‐TSS. Our GRO‐seq data in HepG2 cells show active transcription and nascent OLMALINC RNA expression bidirectionally. (B) OLMALINC has SREBP1/2, pravastatin (pravastatin‐treated HepG2 cells with SREBP1/2 peaks), and RXRA binding sites where an LXRE (LXRE‐DR4) is identified using sequence comparisons. Abbreviations: CAGE, capped analysis of gene expression; RXRA, retinoid X receptor alpha.
