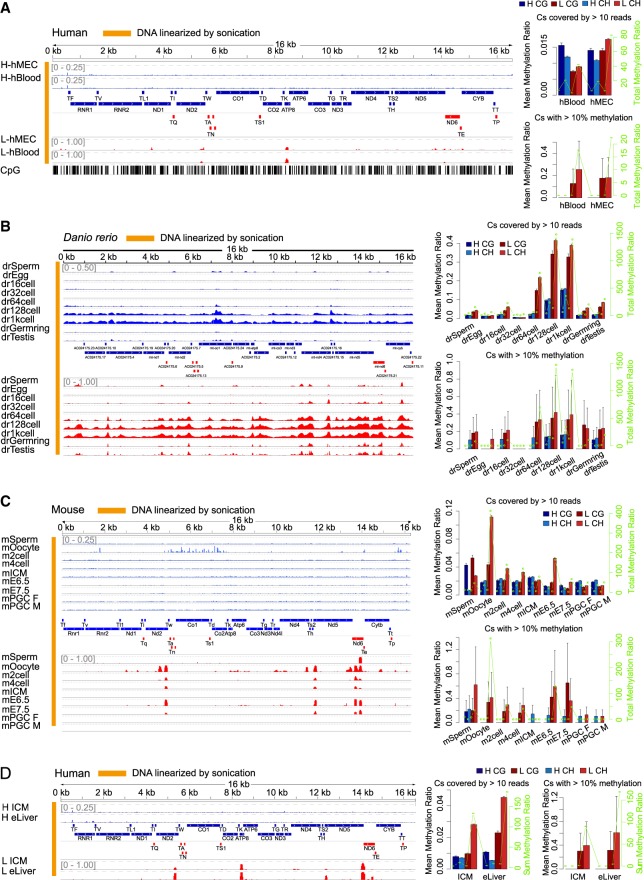
Figure 1.
Strand-specific mapping of mtDNA methylation. (A, left) BS-seq (WGBS) methylation profiles of linearized mtDNA in human B cells (GSM922328 under GSE37578) and mammary epithelial cells (MEC; GSM721195 under GSE29127). The annotations between the H and L strand methylation maps show positions of mtDNA elements: In blue are polypeptide genes, rRNAs and tRNAs coded on the H strand and using L strand as template; in red are polypeptide genes, rRNAs and tRNAs coded on the L strand and using H strand as template. (Right) Mean (left y-axis) and total (right y-axis) mtDNA methylation of CG and CHs on H and L strand, respectively. The mean methylation level is the average methylation level of C sites covered by >10 reads. The total methylation level is the sum of methylation level of C sites covered by >10 reads. We only considered C sites covered by at least 10 reads, with all such C sites (top) or part of them with >10% methylation (bottom) summarized and the stringent cutoff (10%) is used to avoid arguments that some lowly methylated Cs are attributable to background noise. Error bars represent SEM. (B, left) BS-seq (WGBS) methylation profiles of linearized mtDNA in zebrafish sperm, oocyte (eggs), cleavage-stage embryos at the 16-cell, 32-cell, and 64-cell stages, early-blastula 128-cell stage, midblastula stage (MBT) 1000-cell stage (1kcell), the gastrula stage at the germ ring (Germring), and testis from an inbred TU strain (Testis) during early embryogenesis (GSE44075) on the H and L strand. Blue tracks show methylation levels of the H strand (scale from 0 to 0.5), and red tracks show L-strand methylation (scale from 0 to 1.0). Annotations are as in A. (C, left) BS-seq (WGBS) methylation profiles of linearized mtDNA in mouse sperm, oocyte, and early stage embryos including two-cell and four-cell cleavage stages, early ICM, E6.5 embryos, E7.5 embryos, and the primordial germ cells (PGCs) from E13.5 male and female embryos (GSE56697) on the H and L strands, respectively. Blue tracks show methylation levels of the H strand (scale from 0 to 0.25), and red tracks show L-strand methylation (scale from 0 to 1.00). Annotations are as in A. (D, left) BS-seq (WGBS) methylation profiles of linearized mtDNA in mouse late blastocyst (inner cell mass [ICM]) and human post-implantation embryonic liver (eLiver) (GSE49828) on the H and L strands. Blue tracks show methylation levels of the H strand (scale from 0 to 0.25), and red tracks show L-strand methylation (scale from 0 to 1.00). Annotations are as in A.

