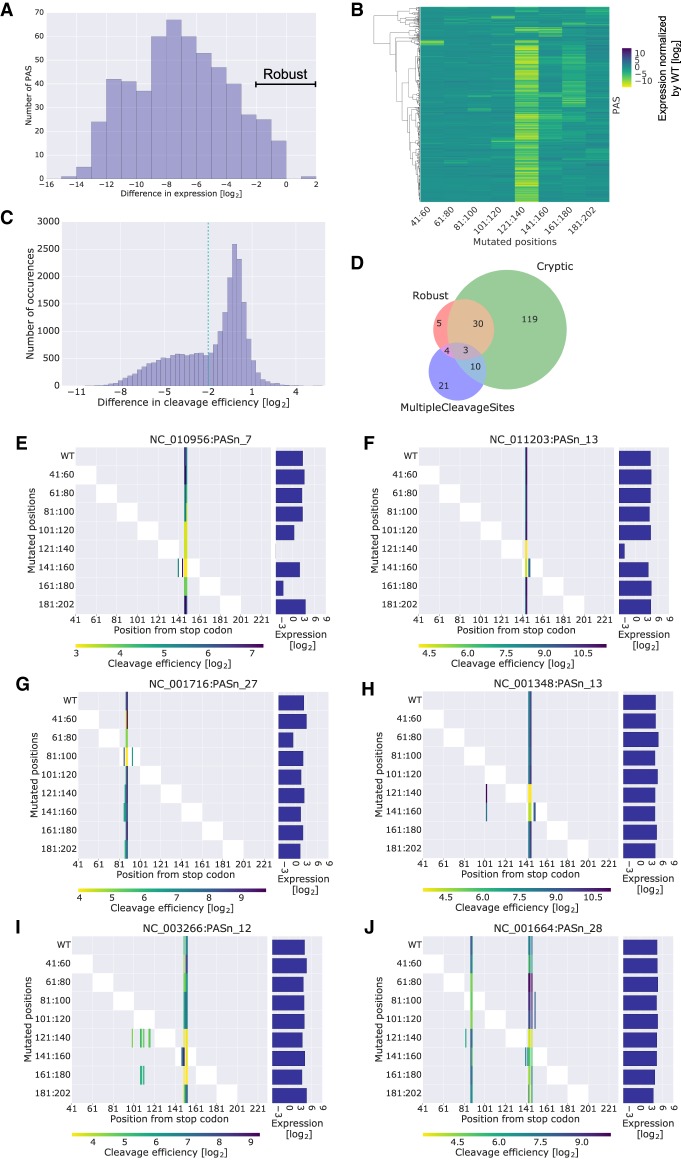
Figure 2.
Scanning mutagenesis reveals a mechanistic link between cleavage efficiency and expression levels. (A) Histogram of the difference in expression between the mutant with the lowest expression and the WT PAS for PASs with cleavage efficiency data. PASs with differences ≥ −2 are considered robust. (B) A clustered heat map where each row is a native PAS subjected to scanning mutagenesis and each column is a range of mutated 20 bp. The values are the expression of the mutant minus the expression of the WT for PASs with cleavage efficiency data. Rows were clustered with ward hierarchical clustering using a cosine distance. Two main clusters are observed, one that is robust to mutagenesis and one that is sensitive at certain mutation blocks. (C) Histogram of the differences in cleavage efficiency calculated per variant per cleaved WT position. The −2 cutoff is used later to define positive and negative sets for motif analysis. (D) PASs with cleavage efficiency data are classified based on their behavior in the scanning mutagenesis data. Robust PASs showed minimal changes in expression levels for all mutants, as annotated in A. PASs whose WT sequence has more than one cleavage site separated by at least 10 bases from one another are classified as MultipleCleavageSites. PASs for which at least one of their mutants has more cleavage sites than the WT sequence are classified as cryptic. (E–J) Visualization of cleavage efficiency and expression levels for example PASs. The right panel is a bar plot of expression levels. The left panel is a heat map of cleavage efficiencies, where each column is a position along the PAS sequence and each row refers to mutated positions within the PAS. The color bar corresponds to the measured cleavage efficiency for each variant at each position. The mutated positions are also visualized by the white blocks in the heat map. Missing cleavage efficiencies in the mutant variants at positions where the WT had a measured cleavage efficiency were imputed with the detection limit (see Methods). Titles correspond to RefSeq IDs of viral genomes followed by the number of the PAS as annotated in the GenBank record.

