Figure 3.
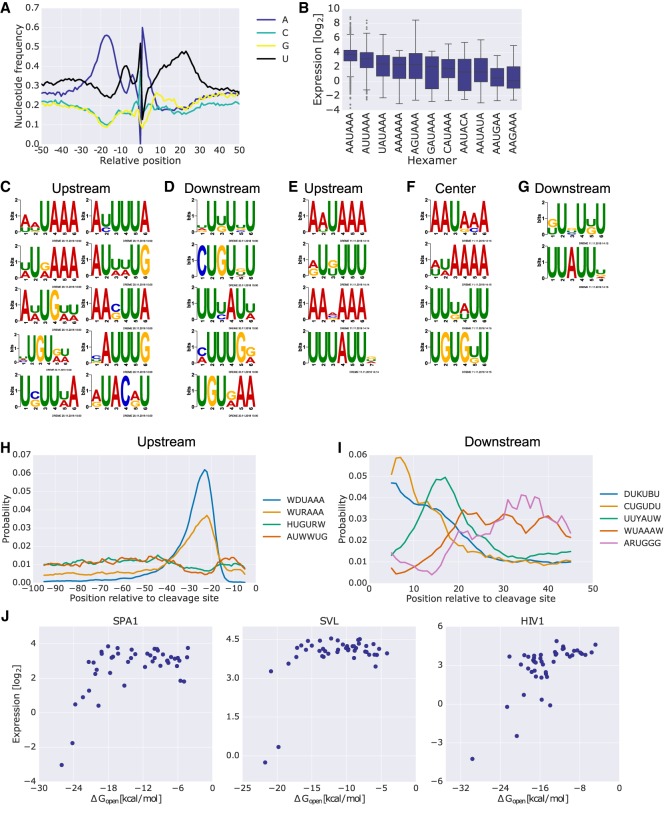
Multiple PAS sequence features have a considerable effect on expression levels and cleavage site location. (A) The nucleotide frequencies surrounding the position of maximal cleavage efficiency of each variant. (B) Box plots comparing the expression levels of sequences grouped by the hexamer found upstream of the position of maximal cleavage efficiency of each native PAS. Only native PASs with a single variation of the hexamer were included. (C,D) Regulatory motifs found using DREME in 100 bp upstream of (C) and 50 bp downstream from (D) the position of maximal cleavage efficiency found in native sequences and also enriched in genomic sequences obtained from K562 3′ end sequencing data. The positive set consisted of library members with expression higher than 2−5, which had cleavage efficiency data. The negative set consisted of library members with expression lower than 2−5. The sequences were taken in corresponding length and orientation to the positive set but with respect to position 145. Only native library sequences were used for the analysis. Only motifs that were significantly enriched in a set of endogenous 3′ UTR sequences (using AME) are presented (enrichment P-value < 0.01) (Methods). (E–G) Regulatory motifs found using DREME in scanning mutagenesis data upstream of (E), overlapping (F), or downstream from (G) the position of maximal cleavage efficiency. Native and mutant 20-bp sequences were used as positive and negative sets, respectively. The regions for analysis were selected with respect to cleavage positions that showed a difference in cleavage efficiency smaller than 2−2. Only motifs that were significantly enriched in a set of endogenous 3′ UTR sequences (using AME) are presented (enrichment P-value < 0.01). All of the center motifs were enriched upstream, while only the bottom two were enriched downstream (Methods). (H,I) CentriMo analysis for the positional preference of each motif found upstream of (H) or downstream from (I) the analysis performed in C and D, respectively. The plot depicts positional distribution of the best match for each of the motifs for results with Fisher E-value < 0.01. Positions are indicated relative to the position of maximal cleavage efficiency. The motifs are indicated in the legend by their consensus sequence (Methods; Supplemental Fig. S2). (J) Expression as a function of ΔGopen, the change in ensemble free energy required to expose the canonical hexamer with an additional 15 bp upstream and downstream. The analysis was performed on rationally designed mutants of three PASs, SPA1 (left), SVL (center), and HIV1 (right).

