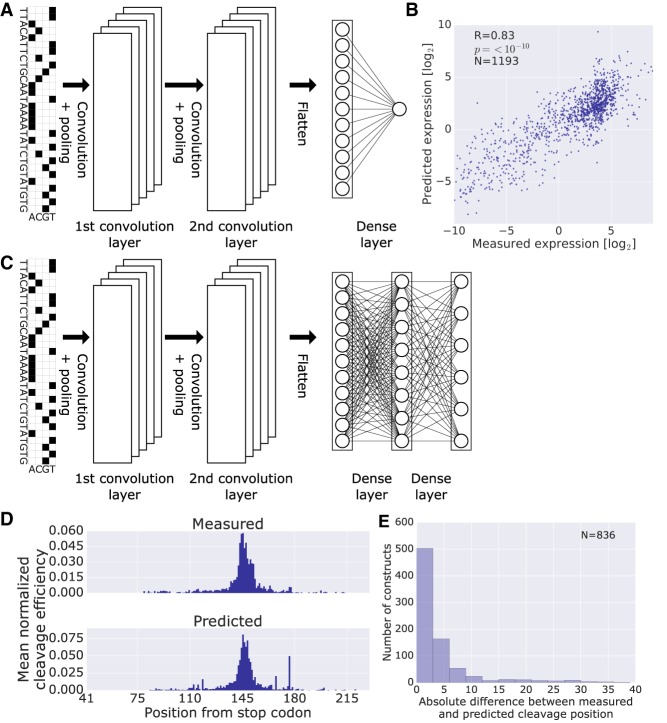
Figure 4.
Prediction of expression levels and cleavage efficiencies from DNA sequence alone using CNNs. (A) Model architecture for prediction of expression levels. The input DNA sequence is one hot encoded and fed into a CNN composed of two convolutional layers and one dense layer with a final output of a single neuron with linear activation (Methods). (B) Scatter plot of predicted versus measured expression levels on held-out data. (C) Model architecture for prediction of cleavage efficiency maps. The input DNA sequence is one hot encoded and fed into a CNN composed of two convolutional layers and two dense layers with a final output of a vector of length 189, the number of positions considered. (D) Per position mean cleavage efficiency calculated over all the library members in the test set. For each member, the cleavage efficiencies were normalized by dividing by their sum, in order to facilitate comparison between the measured distribution and the one achieved by the model. (E) Histogram of the absolute differences between the measured and the most probable predicted cleavage site evaluated on library held-out test data. Only constructs with measured cleavage efficiency maps were used.

