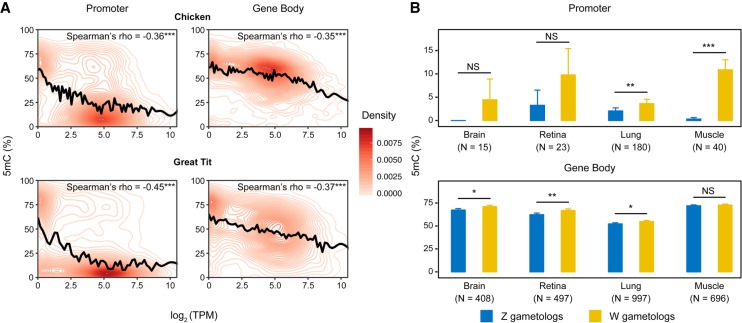
Figure 1.
DNA methylation and transcription in avian genomes. (A) Density of data points as a function of CpG methylation (5mC [%]) and gene expression (log2 [TPM]) in female chickens and a male great tit (for male chickens, see Supplemental Fig. S1). The relationship between methylation and gene expression was smoothed with cubic splines (black lines). Number of genes with CpG methylation data: chicken: N = 11,662 for promoters and N = 11,723 for gene bodies; great tit: N = 14,694 for promoters and N = 14,721 for gene bodies. (B) Comparison of DNA methylation between aligned CpGs of Z and W gametologs. N depicts the number of Z-W-aligned CpGs with at least three mapped reads in each sample. Statistical significance was evaluated using paired Mann–Whitney U tests. For A and B, the promoter of a gene was defined as upstream 1.5 kb to downstream 500 bp of its transcription start site. (***) P < 0.001, (**) P < 0.01, (*) P < 0.05, (NS) not significant.

