Figure 5.
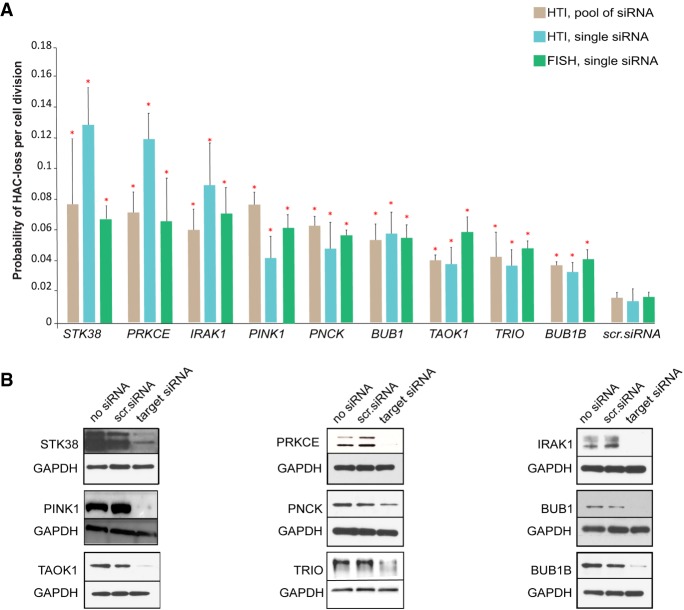
The reconfirmed final list of the CIN gene candidates. (A) The rate of HAC/dGFP loss after knockdown of gene candidates was measured by three independent approaches: (1) after siRNA-mediated knockdown using a pool of siRNAs (brown; the rate was measured by HTI as a proportion of nonfluorescent cells); (2) after knockdown of the target gene using one single siRNA sequence (blue; the rate was measured by HTI); and (3) after knockdown of a target gene using one independent siRNA sequence (green; the rate was measured by FISH). The red asterisks indicate statistical significance (P < 0.05; t-test) when compared to a negative control (scr. siRNA or nontargeting siRNA). (B) Silencing efficiency of each protein was monitored by western blot analysis (Supplemental Table S8).

