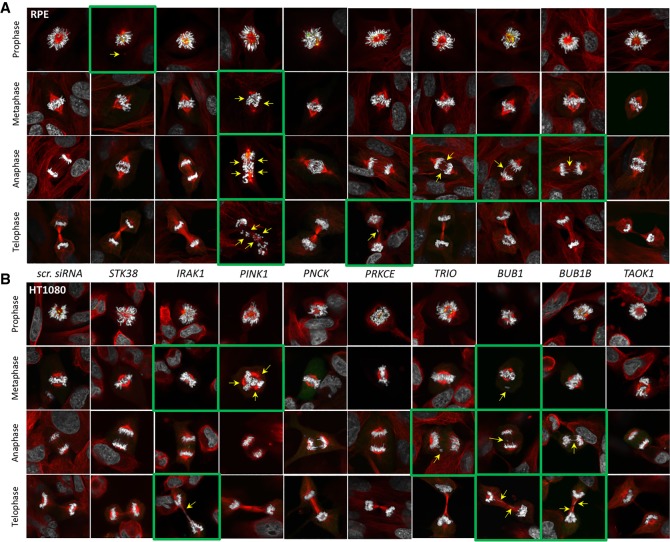
Figure 7.
Analysis of localization of tubulin alpha and MAD1L1 at the different stages of mitosis after knockdown of STK38, IRAK1, PINK1, PNCK, PRKCE, TRIO, BUB1, BUB1B, and TAOK1 genes in RPE (A) and HT1080 (B) cells. (scr. siRNA) negative control. Staining by antibodies against tubulin alpha is marked in red; against MAD1L1, in white. Green squares and yellow arrows point to the observed mitotic abnormalities.

