Figure 8.
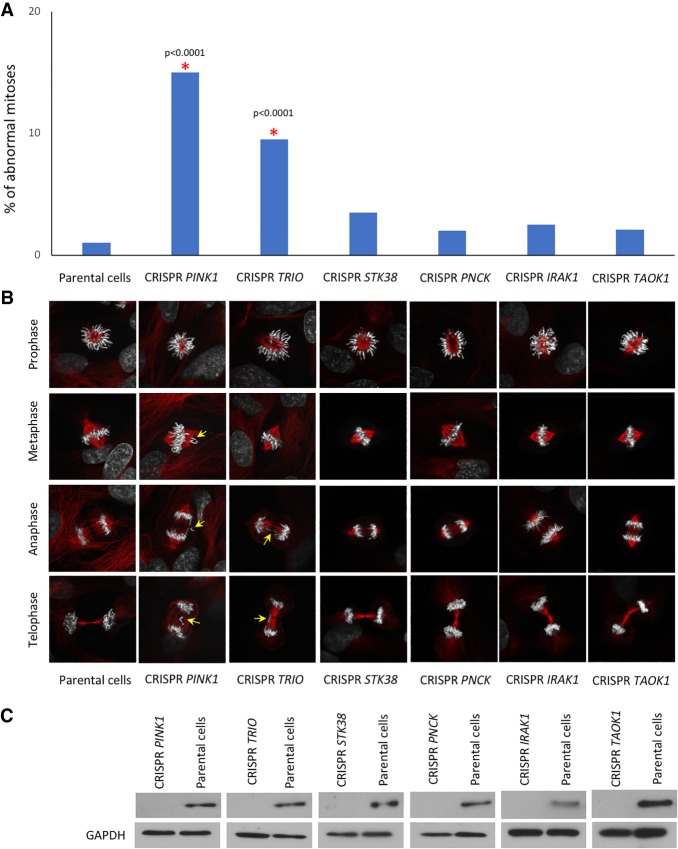
CRISPR/Cas9 disruption of the PINK1, TRIO, IRAK1, PNCK, STK38, and TAOK1 genes. (A) Percentage of abnormal mitoses counted after CRISPR/Cas9 disruption of the PINK1, TRIO, IRAK1, PNCK, STK38, and TAOK1 genes. For statistical significance, Fisher's exact test was applied. A red asterisk indicates statistical significance (P < 0.05) in comparison with negative control (Parental cells). About 150 mitotic events were analyzed. (B) Immunostaining of the cells after CRISPR/Cas9 knockout against tubulin alpha (red) counterstained with DAPI to observe mitotic abnormalities. Yellow arrows point to the identified mitotic abnormalities. (C) Western blot analysis confirming absence of PINK1, TRIO, IRAK1, PNCK, STK38, and TAOK1 proteins after CRISPR/Cas9-mediated knockout of these genes (Supplemental Table S8).

