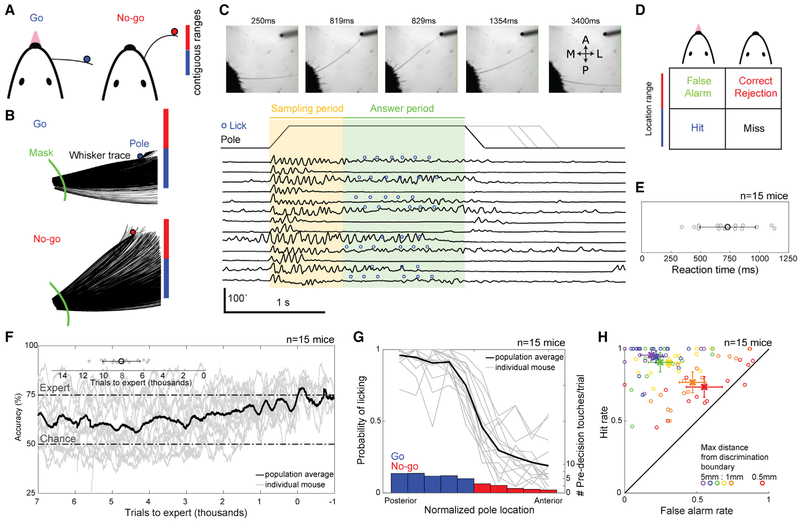
Figure 2. Head-Fixed Task and Performance.
(A) Trained mice report the perceived location of a pole presented along the anteroposterior axis via licking (go) or not licking (no-go).
(B) Overhead view of tracked whisker for two trials. To eliminate variation from fur, azimuthal angle is determined at the intersection of mask and whisker trace.
(C) Trial structure with example imaging frames at top. Pole presentation is triggered 500 ms from session start and takes ~200 ms to come into reach. Azimuthal angle time series for 15 consecutive trials is overlaid with the sampling period (750-ms duration), answer period (1,250-ms duration), and licks.
(D) Possible trial outcomes based on pole presentation and mouse choice.
(E) The average reaction time for each individual mouse (gray circles) and the mean ± SEM for all mice (black circle).
(F) Learning rates for this task highlighting 7,000 trials before and 1,000 trials after reaching expert (75% accuracy over 200 trials). Inset, number of trials required to reach expert for each mouse in gray and population in black (mean ± SD; 8,194 ± 1,816 trials).
(G) Psychometric performance curves for individual mice (gray) and across the population (black) expert in the task (n = 15 mice). Bars denote the mean number of touches prior to decision for go (blue) and no-go (red) trials.
(H) Performance between go/no-go pairs of bins with the max distance of 0.5, 1, 2, 3, 4, and 5 mm from the discrimination boundary. Circles denote individual mice. X denotes mean ± SEM across the population. p values comparing population hit trials to false alarm trials are as follows: 0.5 mm p = 9.2e–3; 1 mm p = 5.2e–13; 2 mm p = 1.5e–15; 3 mm p = 1.5e–15; 4 mm p = 1.5e–15; and 5 mm p = 1.5e–15; 2-sample t-test (t-stat, degrees of freedom: 0.5 mm = 2.6, 276; 1 mm = 7.4, 552; 2 mm = 20.0, 596; 3 mm = 21.8, 569; 4 mm = 26.4, 578; 5 mm = 31.8, 594).

