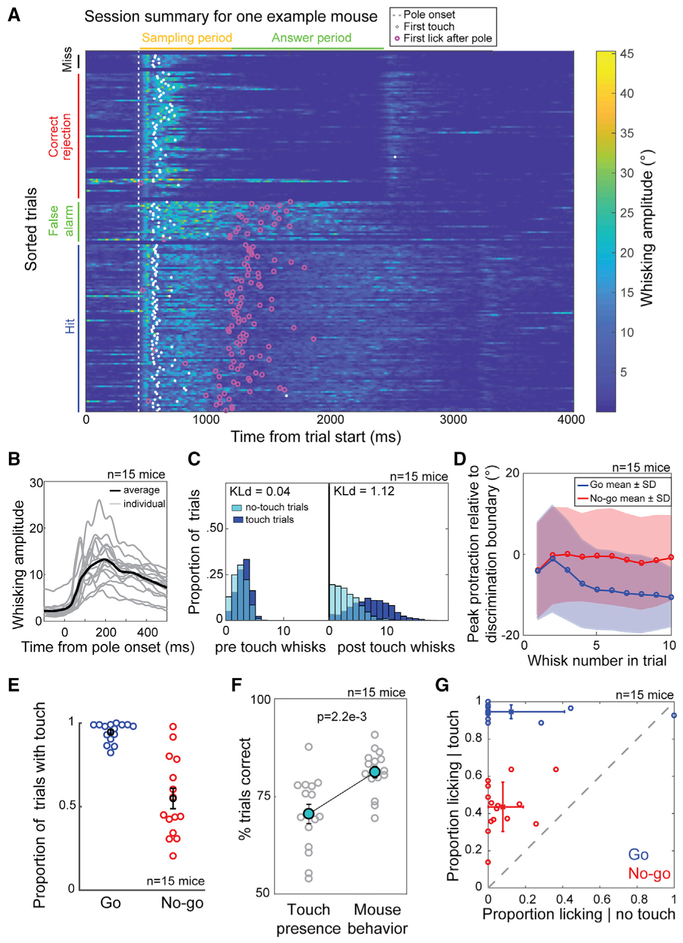
Figure 3. Motor Strategy and Its Influence on Patterns of Touch.
(A) Heatmap of whisking amplitude for one mouse. Trials are sorted with first at the bottom and grouped by trial outcome. White dots are time points of first touch. Magenta circles show time points of first lick after onset of pole presentation.
(B) Whisking amplitude relative to time of pole onset for each mouse (gray) and average for all mice (black). Mean ± SD of whisking onset from cue is 60 ± 16 ms.
(C) Left: population distribution for the number of whisks before first touch. Right: population distribution of the number of whisks after first touch and before decision is shown. For no-touch trials, the median first touch time for that mouse was used. Distribution difference is quantified using Kullback-Leibler divergence (STAR Methods).
(D) Mean ± SD of the peak protraction relative to the discrimination boundary for each whisk in a go (blue) or no-go (red) trial before decision.
(E) Proportion of trials with touch for each mouse based on trial type. Bars represent SEM.
(F) Trial type prediction performance of a logistic classifier based on touch presence compared to each mouse’s trial type discrimination performance. Bars represent SEM. p = 2.2e–3; Wilcoxon signed-rank test.
(G) The proportion of go or no-go trials in which licking occurs conditioned on whether touch occurred on that trial. Bars represent SD.

