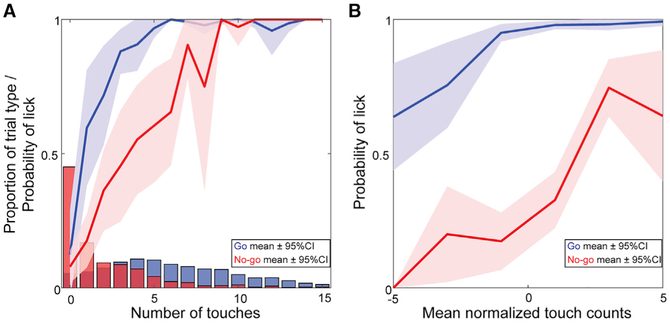
Figure 5. Mice Discriminate Location Using More Than Touch Count.
(A) Population average of touch count distributions and associated lick probabilities for all mice in go (blue) and no-go (red) trials. p values for 0 to 5 touches = 0.64, 4.4e–4, 1.7e–3, 1.1e–4, 7.0e–4, 5.8e–3; two-tailed paired t test (t-stat, degrees of freedom: 0 touches = 0.48, 13; 1 touch = 4.9, 11; 2 touches = 3.9, 13; 3 touches = 5.3, 4; 4 touches = 4.4, 13; 5 touches = 3.5, 10).
(B) Touch count influence on licking controlled for pole position. Number of touches normalized to mean number of touches for each pole position plotted against lick probabilities for go (blue) and no-go (red) trials. Lick probabilities are shown as mean ± 95% confidence intervals.

