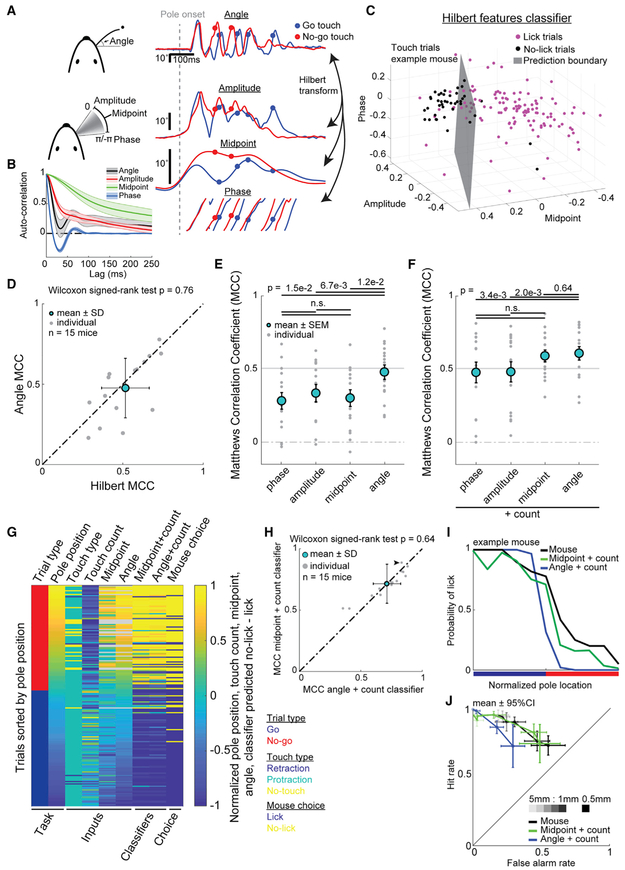
Figure 7. Choice Can Be Best Predicted by a Combination of Touch Count and Whisking Midpoint at Touch.
(A) Time-varying azimuthal angle can be transformed to the Hilbert components amplitude, midpoint, and phase. Example exploration bout for go (blue) and no-go (red) trial is shown.
(B) Average autocorrelation across all mice for angle, amplitude, midpoint, and phase.
(C) Choice prediction space for one mouse using Hilbert features.
(D) Classifier performance measured using MCC between angle and Hilbert features. Bars represent SEM. p = 0.76; Wilcoxon signed-rank test.
(E) Performance (MCC) of classifiers trained with individual model components versus angle at touch. Bars represent SEM. Significant differences: angle to phase (p = 1.5e–2); amplitude (p = 6.7e–3); and midpoint (p = 1.2e–2). Non-significant differences: phase to amplitude (p = 0.23); phase to midpoint (p = 0.80); and amplitude to midpoint (p = 0.52). All compared using Wilcoxon signed-rank test.
(F) Performance (MCC) of classifiers trained with individual model components plus touch count versus angle at touch plus touch count. Bars represent SEM. Significant differences: angle to phase (p = 3.4e–3) and amplitude (p = 2.0e–3). Non-significant differences: phase to amplitude (p = 0.64); phase to midpoint (p = 19); amplitude to midpoint (p = 0.12); and angle to midpoint (p = 0.64). All compared using Wilcoxon signed-rank test.
(G) Heatmap of one sorted session task structure, sensorimotor inputs, classifier predictions, and mouse choice. Continuous variables (pole position, touch count, midpoint at touch, angle at touch, midpoint + touch count choice prediction, and angle + touch count choice prediction) are normalized from minimum (−1) to maximum (+1). NaN data are gray. Categorical variables (trial type, primary touch direction, and mouse choice) are colored as in the legend. See also Figure S3.
(H) Comparison of midpoint + touch count and angle + touch count classifiers for all trials. Bars represent SEM. p = 0.64; Wilcoxon signed-rank test. Black arrow denotes mouse shown in example in (G). See also Figure S4.
(I) Psychometric curves for optimal trial type discrimination performance using midpoint + counts and angle + counts compared against mouse choice for example mouse in (G). See also Figure S5.
(J) Comparison of discrimination resolution between optimal trial type classifiers and mouse performance from Figure 2H. Shading denotes distance from discrimination boundary.

