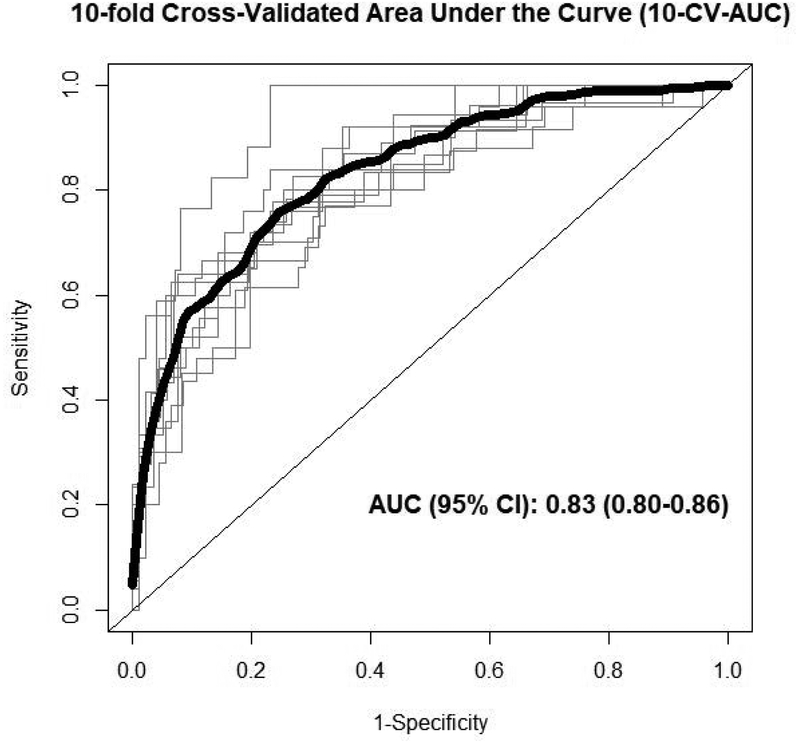
Figure 2.
Ten-fold cross-validated ROC curves. Black bold line represents the 10-fold cross-validated ROC curve, whereas the thin grey lines show ROC curves for each of the 10 iterations using the training-validation (90%−10%) pair datasets excluding consistently selected covariates (i.e. sex, age and smoking) from the model. Abbreviations: CI, confidence interval; ROC, receiver operating characteristic.

