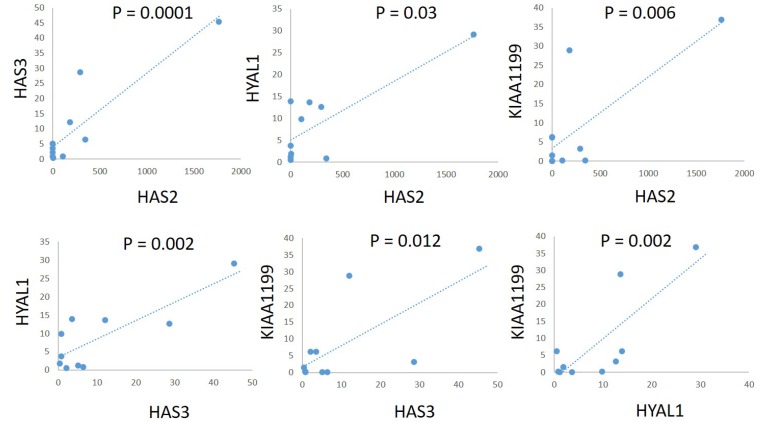
Figure 3. Correlations of mRNA expression levels of HAS2, HAS3, HYAL1, and KIAA1199 in a panel of PDAC cell lines.
There was a significant positive correlation between HAS2 and HAS3 (r = 0.891, P = 0.0001), HAS2 and HYAL1 (r = 0.803, P = 0.003), HAS2 and KIAA1199 (r = 0.762, P = 0.006), HAS3 and HYAL1 (r = 0.83, P = 0.002), HAS3 and KIAA1199 (r = 0.723, P = 0.012), and HYAL1 and KIAA1199 (r = 0.812, P = 0.002).

