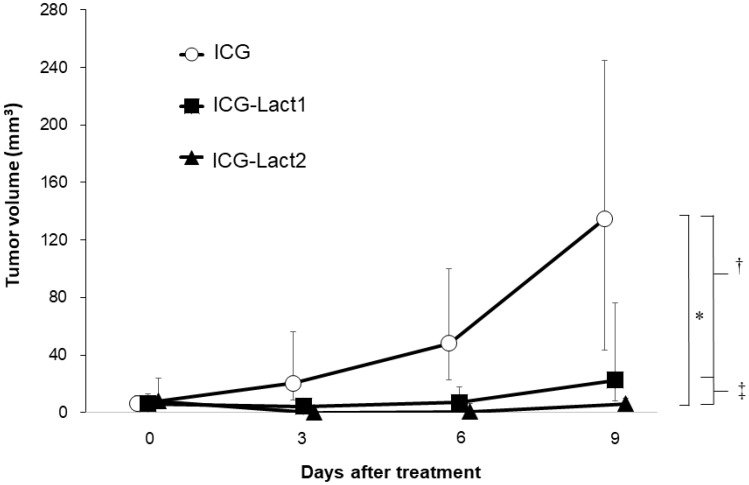
Figure 5. Effect of PDT on tumor growth in ICG and ICG-lactosomes mice with subcutaneous tumors.
On the second day of administration, PDT (1150 mW/cm2, 90 s (100 J/cm2)) was performed in the ICG (ICG (n = 8), open circles) and ICG-lactosomes-once-irradiated (ICG-Lact1 (n = 8), closed squares) groups. The second PDT was performed on day 5 after the first PDT in the ICG-lactosomes-twice-irradiated group (ICG-Lact2 (n = 8), closed triangles). The tumor volumes were measured at the indicated times. * P < 0.001 between the ICG and ICG-Lact2 groups. † P < 0.05 between the ICG and ICG-Lact1 groups. ‡ P < 0.05 between the ICG-Lact1 and ICG-Lact2 groups. The results are presented as the mean ± SEM (n = 8/group).

