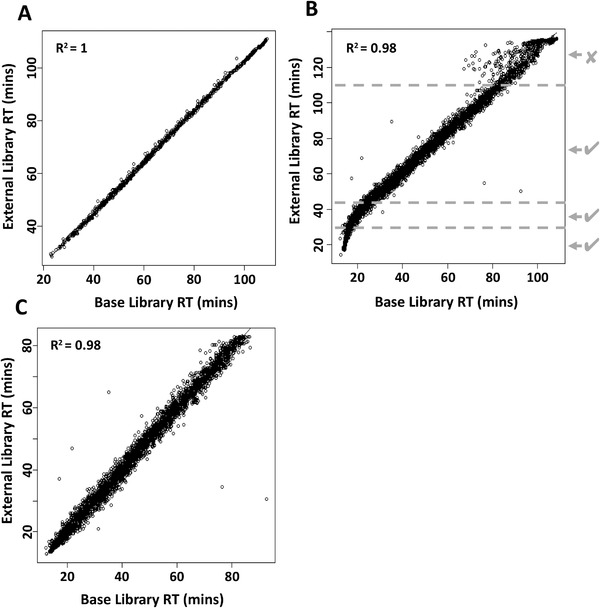
Figure 2.

Concatenation of tissue‐specific spectral libraries. A) Liquid chromatography peptide retention time correlations between tissue‐specific libraries. (A) indicates excellent retention time correlation. B) indicates a situation where additional linearization was required. The external library was manually divided into four parts, three of which are the linear fragments of the plot and the 4th, noisy fragment, which was discarded. For each of the three linear fragments, the linear regression was calculated and the resulting parameters were used to adjust peptide retention times to match the base library. Subsequently, the fragments with corrected retention times were combined and used for library building. C) shows the outcome following normalization.
