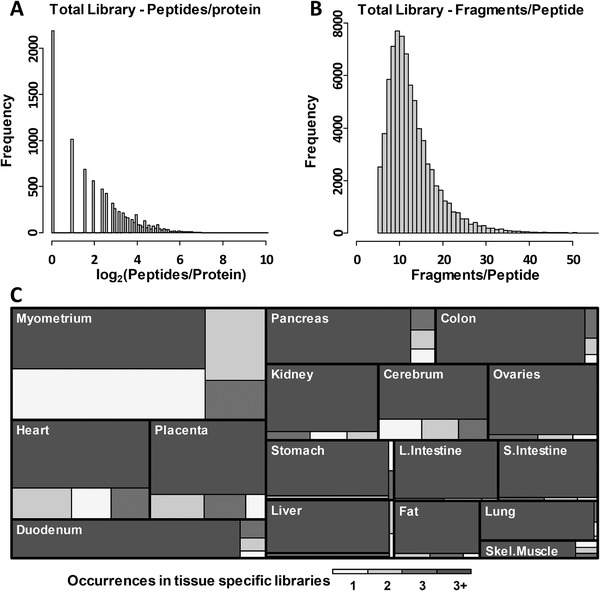
Figure 3.

Summaries of library composition. Histograms indicating A) the number of peptides per protein and B) the frequency distributions of fragment ions per peptide. C) Tissue‐specific library contributions to the total library. Different colors indicate what proportion of the library is shared between multiple tissues (from 1 to 3+, 1 being unique to one tissue only and 3+ being found in more than three tissues).
