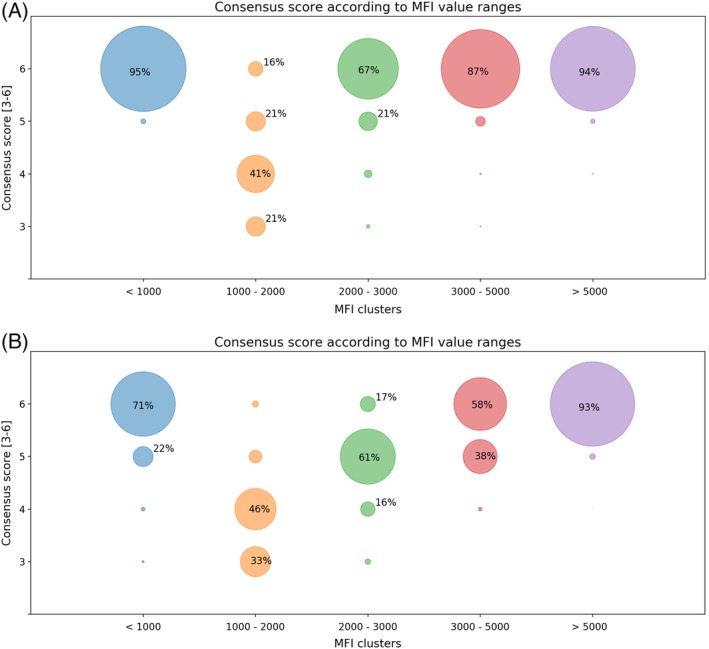
Figure 4.

Consensus score according to MFI value ranges. Each circle represents the specificities within the MFI range (X axis) achieving a corresponding consensus score (Y axis). A, HLA antibody specificity assignment from LabScreen SAB assay. B, Acceptable mismatches designated. Most of the assignments with lower levels of consensus are in the regions with MFI values ranges from 1001 to 2000 for the SAB assay (A) and 1001 to 5000 for acceptable mismatches (B)
