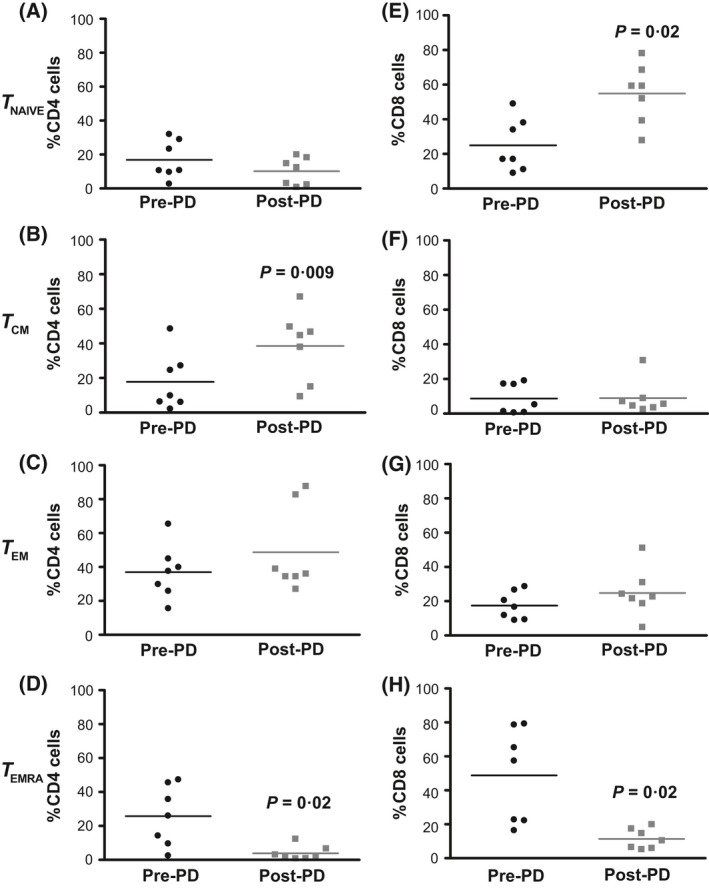
Figure 2.

Distribution of memory T‐cell subsets in ATIR101 cells before and after photodepletion. Memory T‐cells were analysed pre‐ and post‐photodepletion (PD) by flow cytometry for CD62L, CD45RA and CD45RO expression and gated on CD4 (A–D) or CD8 (E–H) cells. CD45RO − CD45RA + CD62L+ defined TNAIVE; CD45RO + CD45RA − CD62L−, effector memory (TEM) cells; CD45RO + CD45RA − CD62L+, central memory (TCM); and CD45RO − CD45RA + CD62L−, terminally differentiated effector (TEMRA) cells. Bars represent mean values (n = 7) and P values correspond to paired t‐tests between pre‐ and post‐photodepletion results.
