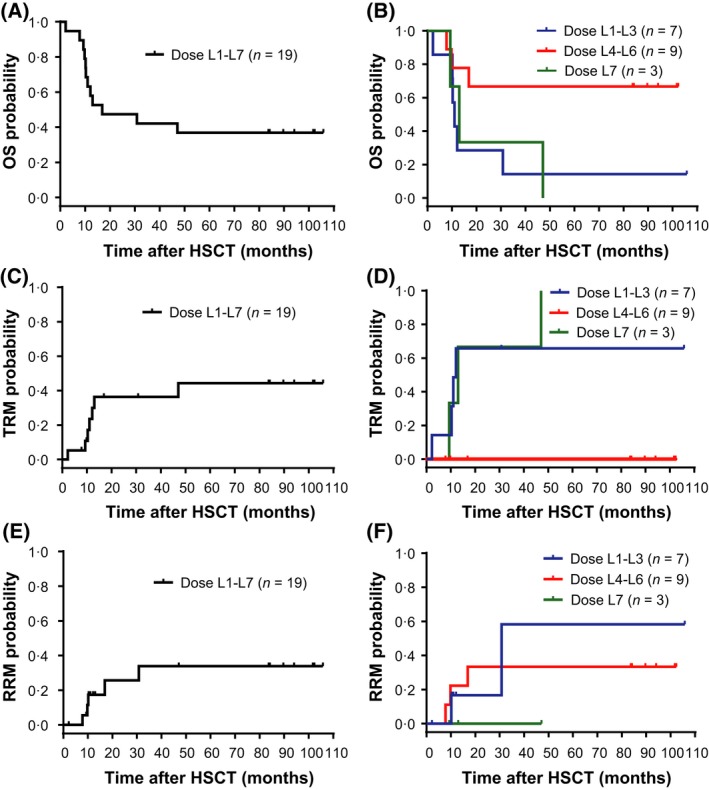
Figure 6.

Long‐term patient outcomes. Kaplan–Meier plots for OS (A, B); TRM (C, D); and RRM (E, F) for up to 9 years post‐HSCT. Panels (A), (C), and (E) display survival and mortality for all patients who were administered ATIR101 (N = 19). Panels (B), (D), and (F) display survival and mortality separated according to the combined L1–L3 (blue line; n = 7), L4–L6 (red line; n = 9), and the L7 (green line; n = 3) ATIR101 dose cohorts. HSCT, haematopoietic stem cell transplantation; OS, overall survival; RRM, relapse‐related mortality; TRM, transplant‐related mortality.
