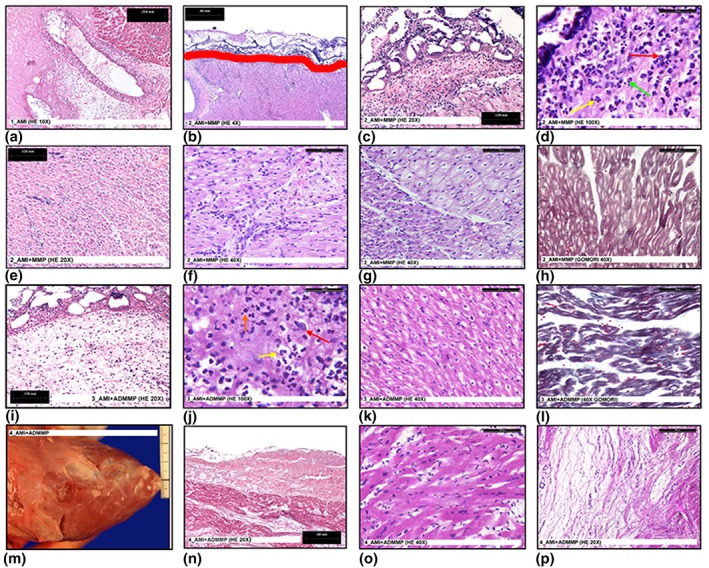
Figure 2.

(a) A necrotic myocardium area in 1_AMI (HE 10×); (b) patch adhesion in 2_AMI + MMP. Red line shows the border between patch (up) and epicardium (down) (HE 4×); (c) abundant inflammatory cells under the epicardial layer in 2_AMI + MMP (HE 20×); (d) abundant inflammatory cells under the epicardial layer in 2_AMI + MMP. High magnification (HE 100×). The image shows the presence of macrophages (red arrow) neutrophils (yellow arrow) and eosinophils (green arrow); (e) inflammatory cells inside the myocardium in 2_AMI + MMP (HE 20×); (f) inflammatory cells inside the myocardium in 2_AMI + MMP. High magnification (HE 40×); (g) normal (on the left) and degenerated (on the right) myocardium tissue in 2_AMI + MMP (HE 40×); (h) degenerated myocardium in 2_AMI + MMP (Gomori 40×); (i) inflammatory cells under the epicardial layer in 3_AMI + ADMMP (HE 20×); (j) inflammatory cells under the epicardial layer in 3_AMI + ADMMP. High magnification (HE 100×). The image shows the presence of macrophages (red arrow), neutrophils (yellow arrow), and lymphocytes (orange arrow); (k) suffering myocardium in 3_AMI + ADMMP (HE 40×); (l) suffering myocardium in 3_AMI + ADMMP (Gomori 40×); (m) macroscopic image of the reabsorbed patch in 4_AMI + ADMMP; (n) microscopic image of the reabsorbed patch in 4_AMI + ADMMP (HE 20×); (o) normal myocardium in 4_AMI + ADMMP (HE 40×); (p) mixoid tissue in 4_AMI + ADMMP (HE 20×) [Colour figure can be viewed at wileyonlinelibrary.com]
