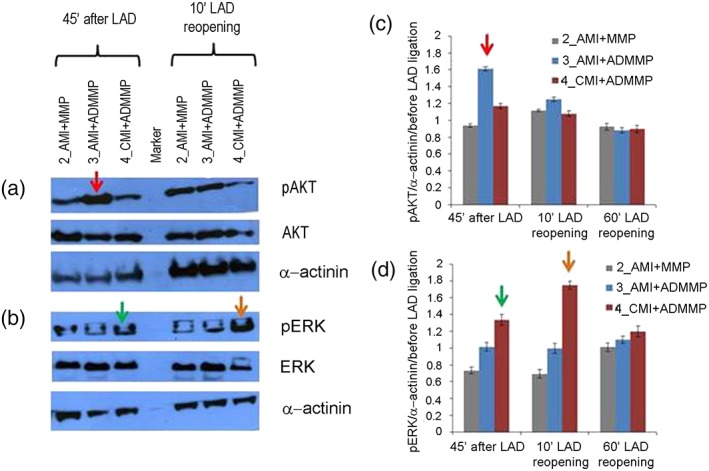
Figure 3.

Analysis of reperfusion injury salvage kinase (RISK) pathway activation: (a, b) western blot analysis of phosphorylated extracellular signal‐regulated kinase AKT (pAKT) and phosphorylated ERK 1/2 (pERK 1/2) normalised to total AKT and ERK 1/2 proteins and to α‐actinin; one representative experiment (out of three) per animal is shown; (c, d) quantification of western blots for pAKT and pERK normalised to α‐actinin and to phosphorylated proteins, detected in the biopsies taken before LAD ligature. SEM of three independent blot quantifications per animal is shown. Differences exceeding ±3 SEM were considered significant and indicated by coloured arrows. A red arrow indicates AKT phosphorylation increase after LAD ligature in animal 3_AMI + ADMMP versus 2_AMI + MMP (1.61 vs. 0.94), a green arrow indicates ERK 1/2 phosphorylation increase after LAD ligature in animal 4_AMI + ADMMP versus 2_AMI + MMP (1.33 versus 0.73), and an orange arrow indicates ERK 1/2 phosphorylation increase 10 min after LAD reopening in animal 4_AMI + ADMMP versus 2_AMI + MMP (1.75 versus 0.69) [Colour figure can be viewed at wileyonlinelibrary.com]
