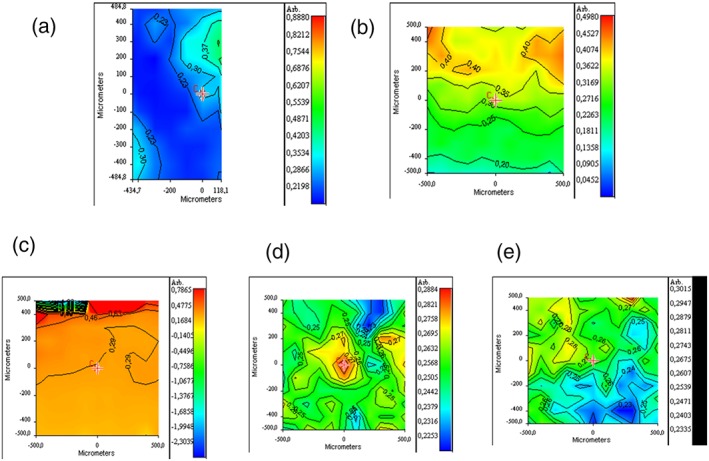
Figure 4.

FT‐IR chemical imaging: (a) GAG/protein ratio at the interface with ADMMP in myocardial samples of 3_AMI + ADMMP, (b) GAG/protein ratio in myocardial samples of 2_AMI + MMP. GAG/protein ratio for (c) control healthy tissue, (d) myocardial tissue of 4_AMI + ADMMP in the correspondence of the proximal area, and (e) distal area respect to ADMMP position [Colour figure can be viewed at wileyonlinelibrary.com]
