
Table 2.
Effect of different Al/Ru‐ratios.[a]
| Entry | Al/Ru | Ru[b]
[mol %] |
Conv. [%][c] |
Sel. [%] |
Mw
[d]
[g mol−1] |
M
n
[d]
[g mol−1] |
|---|---|---|---|---|---|---|
| 1 | 2.5 | 3 | 91 | 92 | 1200 | 600 |
| 2 | 2.5 | 1 | 62 | 98 | 2200 | 800 |
| 3 | 10 | 0.25 | 33 | 73 | 2250 | 1500 |
| 4 | 20 | 0.125 | 62 | 100 | 2400 | 1400 |
| 5 | 15 | 1 | 28 | 41 | 2100 | 1300 |
| 6 | 7.5 | 1 | 49 | 100 | 2400 | 1400 |
| 7 | 2.5 | 1 | 58 | 100 | 2700 | 1600 |
| 8 | 1 | 1 | >99 | 0 | n.d.[e] | n.d.[e] |
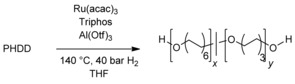
[a] Conditions: PHDD (200 mg, 1.28 mmol COOR), Ru(acac)3 (5 mg, 13 μmol, 1 mol %), Triphos ligand (12 mg, 20 μmol, 1.5 mol %), Al(OTf)3 (15 mg, 33 μmol, 2.5 mol %), solvent (2 mL), 140 °C, 24 h. [b] w.r.t. amount of COOR groups in the polyester. [c] Calculated from NMR spectra. [d] Determined by GPC. [e] No oligomers were detected inside the calibration range of the GPC method