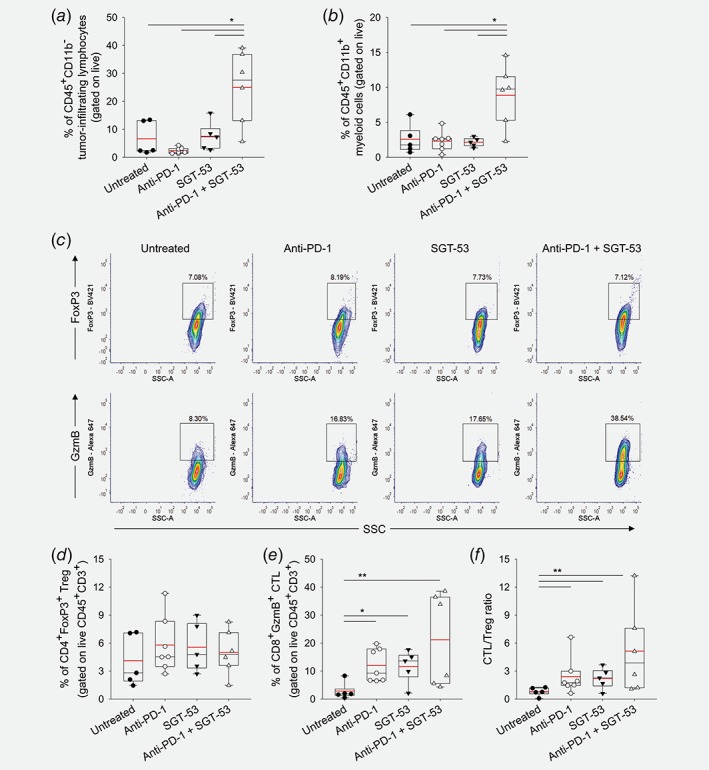
Figure 2.

The combination of anti‐PD‐1 and SGT‐53 enhances immune responses in vivo. Tumor‐infiltrating immune cells were assessed via flow cytometry. (a) Tumor‐infiltrating lymphocytes and (b) myeloid cells were identified by gating CD45+CD11b− live cells and CD45+CD11b+ live cells, respectively. *p < 0.001, **p < 0.05, t‐test with ANOVA. n = 5–7/group. (c) Representative FACS plots of Treg (CD3+CD4+FoxP3+, upper panels) and CTL (CD3+CD8+GzmB+, lower panels). Quantifications of (d) Treg and (e) CTL were plotted. (f) The ratio of CTL/Treg. *p < 0.001, **p < 0.05, t‐test with ANOVA. n = 5–7/group. Red lines indicate average percentage of cells. [Color figure can be viewed at wileyonlinelibrary.com]
