Figure 4.

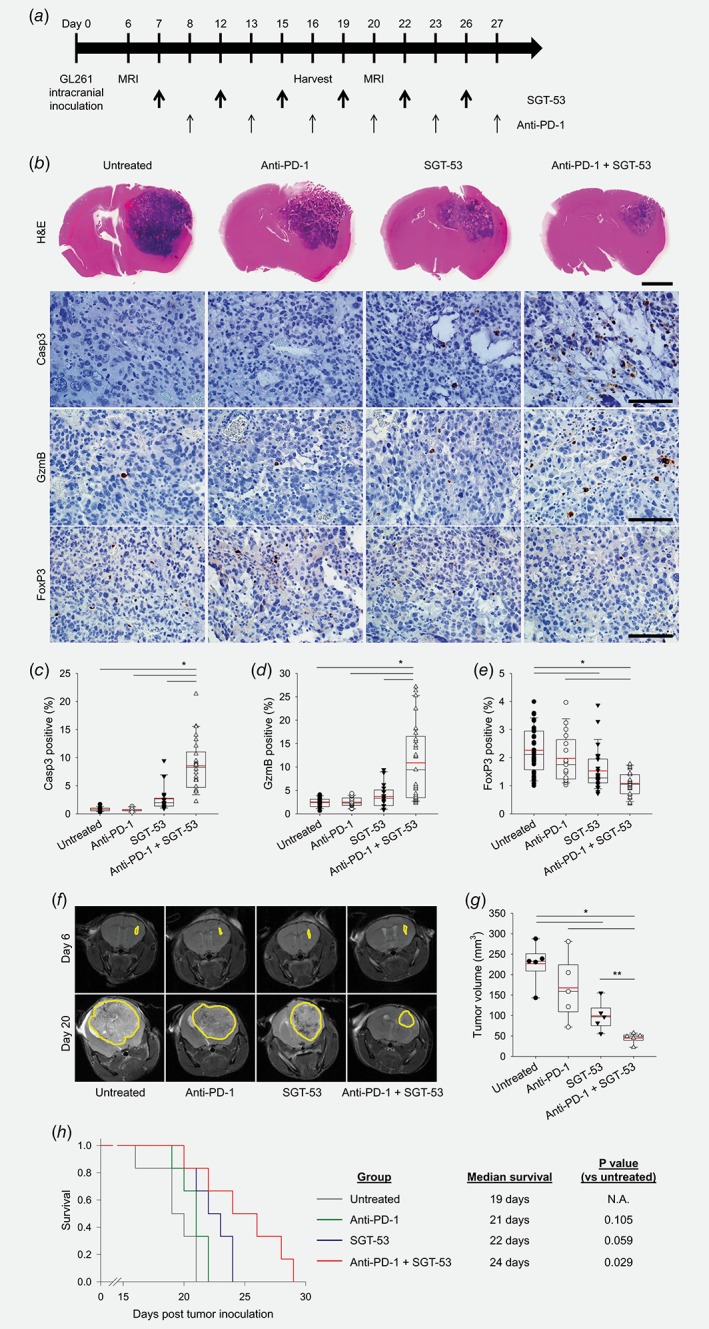
Combination treatment enhances tumor growth inhibition and survival in intracranial GL261 tumors. (a) Treatment schedule. Based on the MRI on Day 6, tumor‐bearing mice were randomized to therapy with anti‐PD‐1 (200 μg antibody), SGT‐53 (30 μg DNA) or combination of both agents (n = 10). (b) Histological examination of mouse brains on Day 16. Representative H&E (Scale bar, 2 mm) and immunohistochemical staining of Casp3, GzmB, and FoxP3 (Scale bars, 100 μm). Quantifications of positive stain of (c) Casp3, (d) GzmB, and (e) FoxP3. *p < 0.001, **p < 0.05, t‐test with ANOVA (n = 20). (f) Representative MR images acquired on Days 6 and 20. Yellow lines surround tumor area. (g) A volumetric assessment of brain tumors. *p < 0.001, **p < 0.05, t‐test with ANOVA (n = 5). Red lines indicate average tumor volume. (h) Kaplan–Meier survival curves (left panel). Median survival and statistical significance were determined by log‐rank test (right panel, n = 6). [Color figure can be viewed at wileyonlinelibrary.com]
