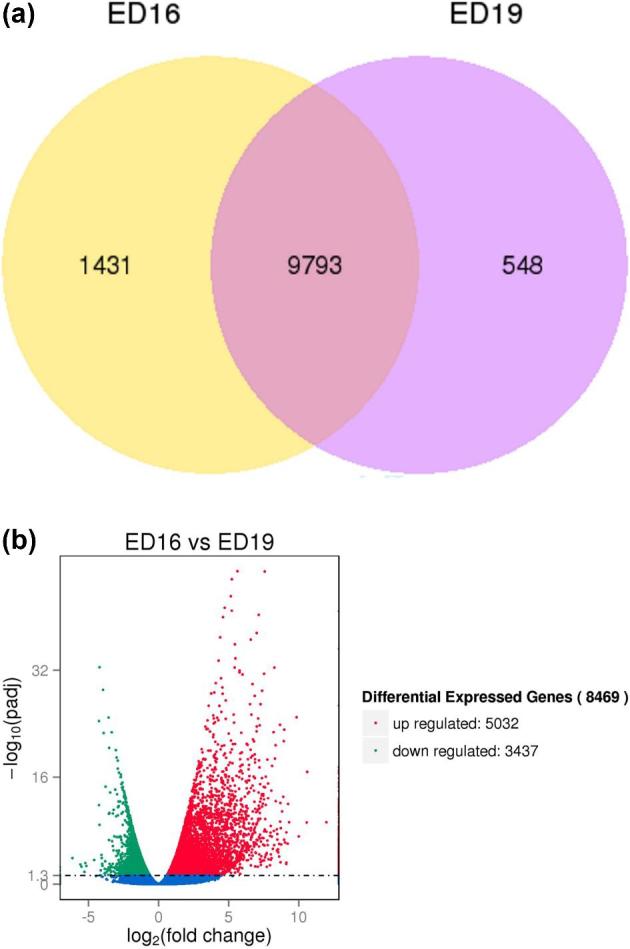
Figure 2.

(a) Venn diagram of expressed genes for embryonic days (ED) 16 and 19 bursal cells from Hy-Line W-36 embryos. Venn diagram of expressed genes between ED16 and ED19 is shown here. The yellow portion (left) represents the number of genes expressed during ED16, the purple portion (right) represents the number of genes expressed during ED19, and the middle portion represents the genes that were expressed during both ED16 and ED19. (b) Volcano plot for differentially expressed genes for ED16 and ED19 bursal cells from Hy-Line W-36 embryos. The x-axis shows the fold change in gene expression between different samples, and the y-axis shows the statistical significance of the differences. Significantly up- and downregulated genes are highlighted in red and green, respectively. Genes did not express differently between ED16 and ED19 are in blue.
