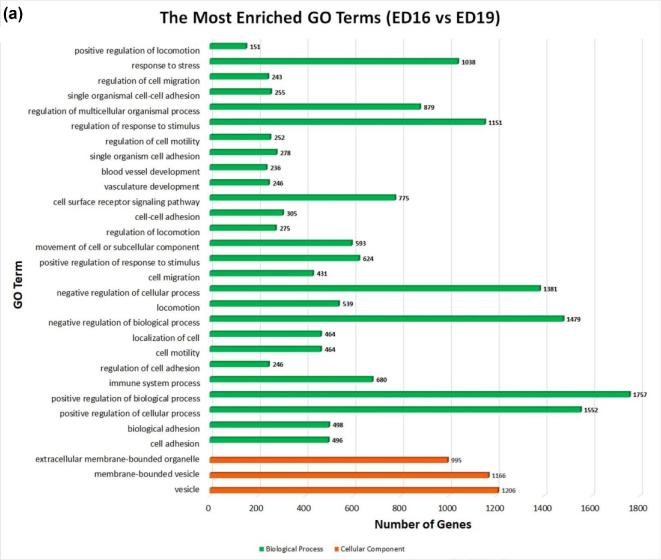
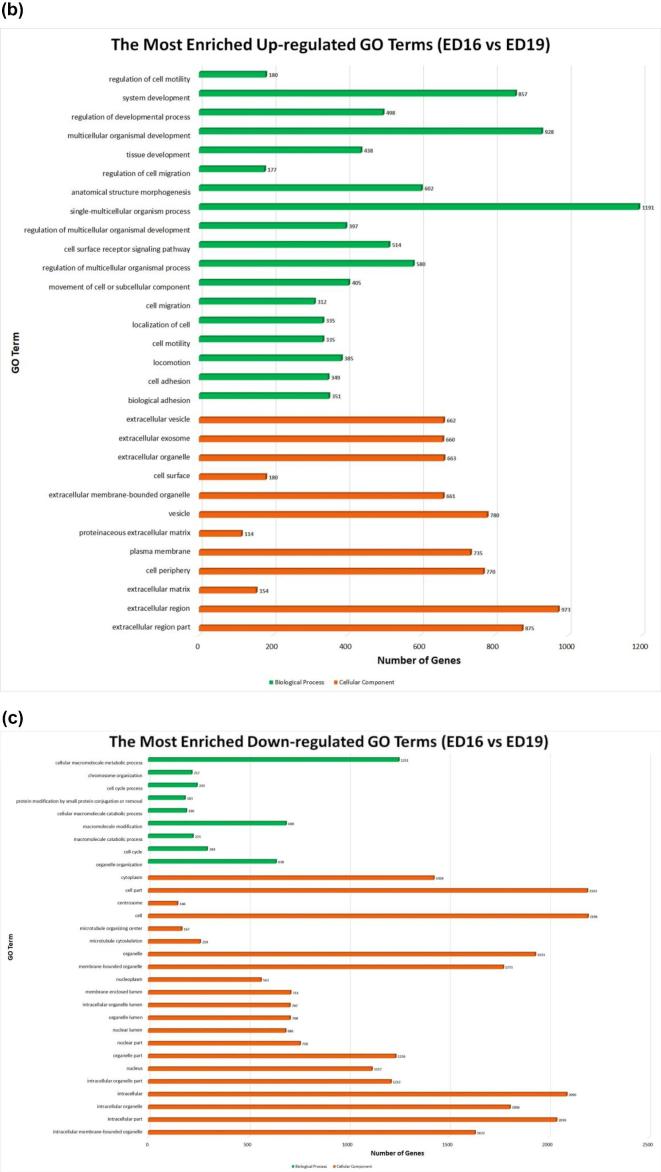
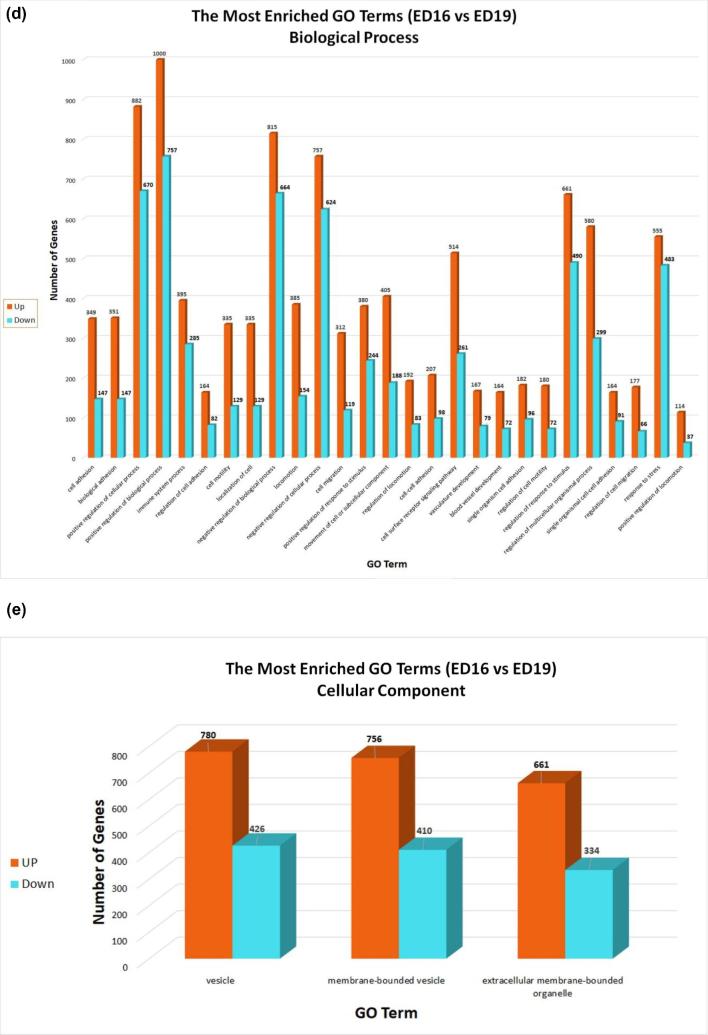
Figure 3.
Gene ontology enrichment bar chart of DEGs for embryonic days 16 and 19 bursal cells from Hy-Line W-36 embryos. (a) The most enriched GO terms. (b) The most enriched upregulated GO terms. (c) The most enriched downregulated GO terms. (d) The most enriched biological process up-down GO terms. (e) The most enriched cellular component up-down GO terms. GO enrichment bar chart of DEGs: the GO enrichment bar chart of DEGs presents the number of DEGs enriched in biological process, cellular component, and molecular function. The 30 most significant enriched terms are selected. (a) The y-axis is the enriched GO term; x-axis is the number of DEGs enriched in this term. Colors represent different GO types: biological process (green color), cellular component (orange color), and molecular function. (b) The y-axis is the enriched upregulated GO term; x-axis is the number of DEGs enriched in this term. Colors represent different GO types: biological process (green color), cellular component (orange color), and molecular function. (c) The y-axis is the enriched downregulated GO term; x-axis is the number of DEGs enriched in this term. Colors represent different GO types: biological process (green color), cellular component (orange color), and molecular function. (d) The y-axis is the enriched GO term for biological process; x-axis is the number of DEGs enriched in this term. Colors represent up- and downregulation. (e) The y-axis is the enriched GO term for cellular component; x-axis is the number of DEGs enriched in this term. Colors represent up- and downregulation.


